

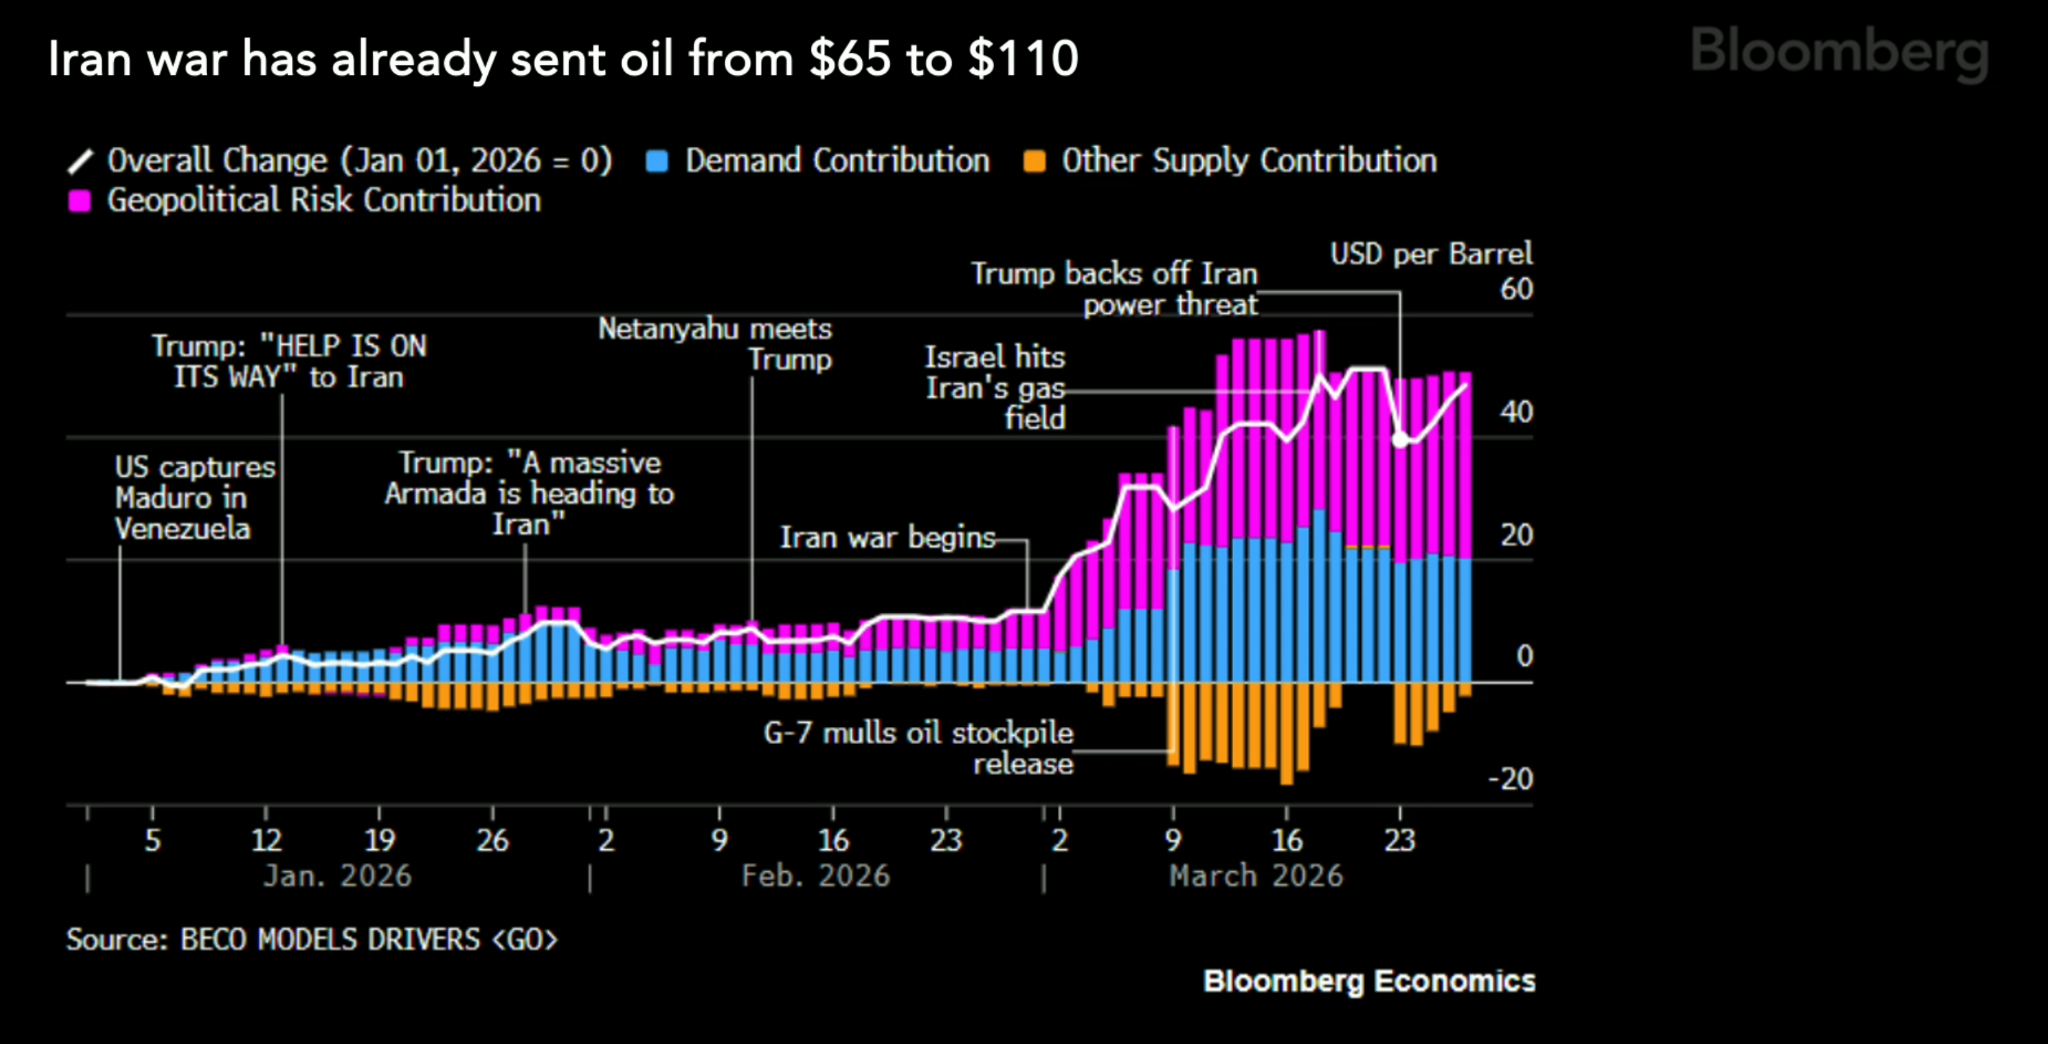
The Iran War remains the single most influential variable for transportation markets and global economies at this time. So I'll be providing another update on that front to start.
Prior to the Iran War, it was estimated that the price of a barrel of oil in 2026 would be almost too low. It already seems crazy to think about, but there was going to be an estimated 3 million barrels per day of oil surplus in the market in 2026 due to increased global oil production. This production was going to keep oil prices and therefore diesel prices pretty low. I believe I covered this in a former newsletter because it was expected to have an impact on oil activity in the southern United States where oil fields were slowing down due to weaker demand in the market. But now oil prices are the single biggest macroeconomic talking point today, in every country. So here is a brief update.
Bloomberg Intelligence put two oil prices, $110 per barrel and $170 per barrel, into their global shock model to show the estimated impact. Moving up from 110 to 170 doubled the impact on economies. At $110 per barrel UK and Euro GDPs dropped by about half a percentage point and inflation went up 1 percentage point. Moving from 110 to 170 doubles the impact. The hit to GDP and inflation increases 100%, to a full percentage and 2%. The impact is different for the US since we are an oil rich nation. We still take double the impact on inflation, but not on GDP growth. So the macroeconomic forecasts for each nation are currently extremely sensitive to the price of a barrel of oil.
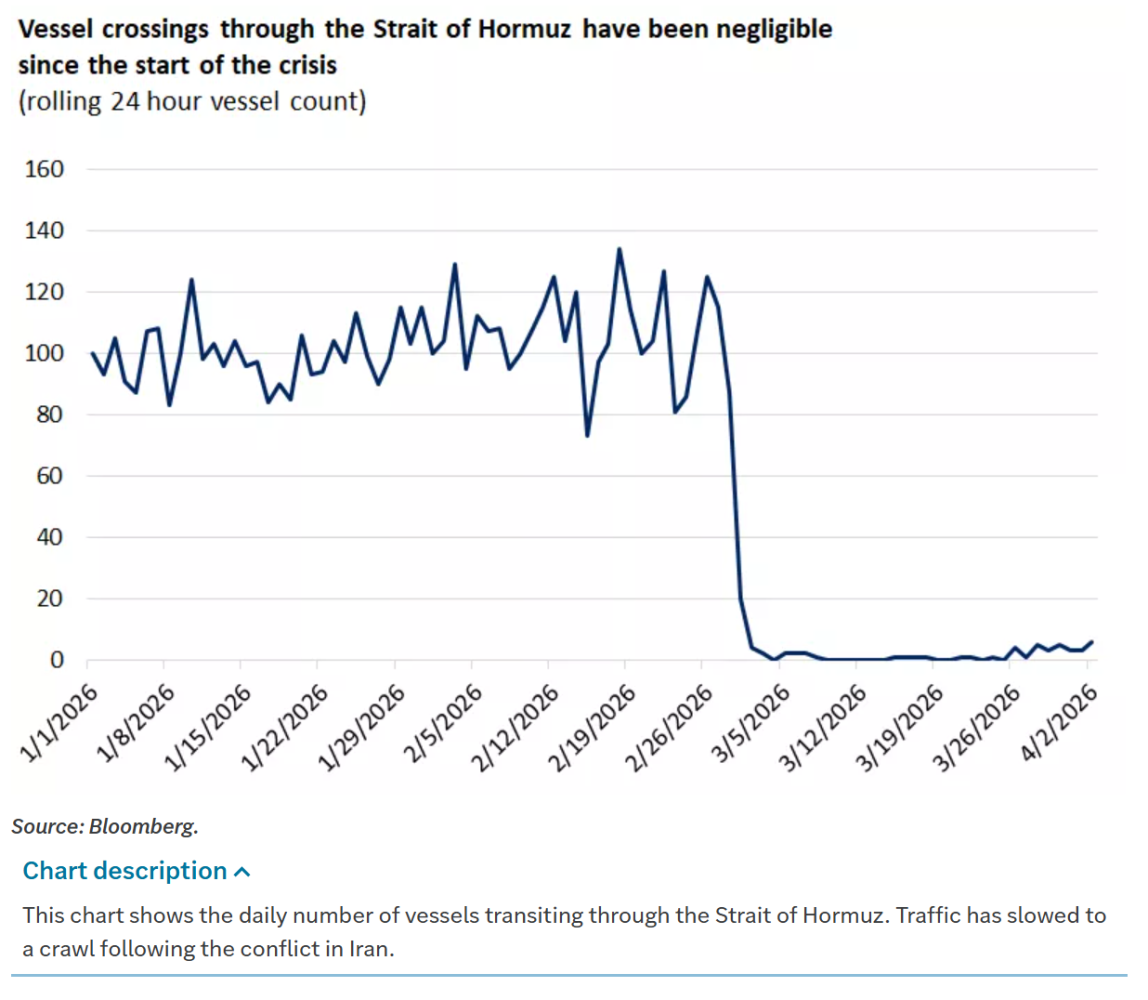
Beyond growth and inflation, higher oil prices also shift income globally. As prices rise, income moves from consuming economies to producing economies. Countries like China, India, and much of Europe face a greater income drag as prices increase, while producers such as the U.S., Canada, Norway, and parts of the Middle East benefit. The magnitude of that shift depends on the size of the oil shock and, in the case of Middle Eastern producers, their ability to move supply through critical infrastructure like the Strait of Hormuz.
So, since the price of a barrel of oil is so important, where should we expect oil prices to be? Blomberg analysts had this to say:
“We think given the level of disruption that we have seen, given the diversion that we have seen out the Strait of Hormuz, given the emergency inventory withdrawal from the IEA and others, we think 110 per barrel sounds about right. We say this because before the war began, we did analyze the impact of the closure of the Strait of Hormuz on oil prices, on the global economy. And we thought that oil would settle at around $108 per barrel. If you look at oil prices since the conflict began on the 28th of February, they averaged about 100. This is a logistical shock, not a resource shortage. Each additional month of closure has a major global impact. Oil demand falls by about 2 million barrels per day. Supply drops by about 11 million barrels per day. This tightens the market pretty significantly, reducing the expected 2026 surplus from over 3 million barrels per day before the war to as low as .7 million barrels per day in the June reopening case. So it’s a really, really significant tightening and prices really respond accordingly. Here we see Brant averaging about $78 per barrel in 2026 if the straight reopens in April. But this changes rapidly if disruption and closure continues. So prices could potentially reach $154 per barrel if reopening is delayed until June. We think prices will likely peak around that reopening moment when the uncertainty clears a little bit. But logistics really are the tight part of the market there and are causing higher prices. It’s worth noting that outside of this disruption, supply fundamentals were relatively strong with growth from OPEC plus countries like Brazil, Guyana and Canada before.”
Edward Jones market analysts also provided their forecasts for potential outcomes of the price of oil and their impact on global economies:
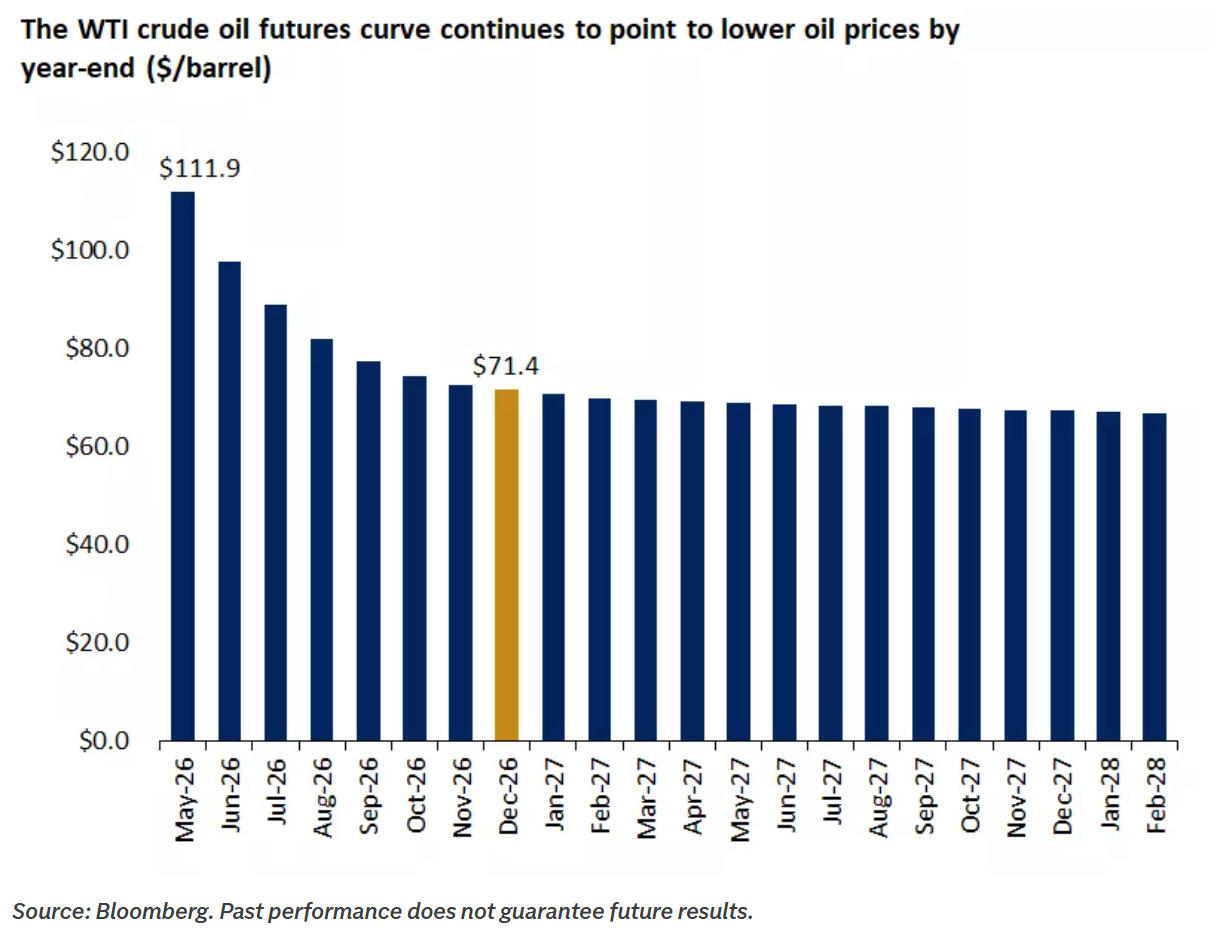
“Tail-Risk Scenario (three to four months of closure): If the strait is essentially closed for the next three to four months, oil prices will likely move sharply higher and physical oil and petroleum shortages could emerge across the globe. We think there would be meaningful downward pressure on the global economy, as oil prices rise further and second-order impacts like rising fertilizer and petro-chemical prices start impacting food and manufacturing costs. In this scenario, we see the probability of recession, especially in countries in Asia and Europe, rising substantially. The U.S. economy likely slows to below-trend levels as well, given higher prices at the pump and in grocery stores, putting immediate pressure on lower-income households and offsetting many of the tax refund gains. Base-Case Scenario (three to four additional weeks of closure): In this case, the duration of the oil shock is closer to three to four additional weeks, before the Strait of Hormuz slowly starts reopening, and the spillover impacts are likely more contained. We believe oil prices should gradually move lower, toward $70-$80 range for WTI, and the global economy avoids recession. In the U.S., while economic growth may be negatively impacted, we would expect GDP growth to be in line with trend levels of 1.5% to 2.0%. Headline inflation would likely still rise toward 3.5% in the near term, but could moderate over time. In this scenario, we would expect equity markets to continue to deliver modestly positive returns, driven still by U.S. stock markets. In our view, the second, more benign scenario remains the highest probability outcome for now, given it would benefit all parties involved. Notably, markets are also pricing in a relatively short-lived oil price shock. The WTI futures curve continues to point to a sharp deceleration in oil prices, returning to around $71 by year-end. This indicates that investors are also viewing this crisis and oil shock as one that will start to revert to the mean in the weeks ahead.”
And while oil has already hit $110 per barrel, it has come down some since. This week, at the time of writing this on Friday 4/10 oil came down to roughly $98 a barrel, and is on pace for a 11% weekly decline. While oil is the main headline, here is an update to the Iran War as of the morning of 4/10 during my writing.
Major Damage to Iran’s Military Capabilities:
Operation Epic Fury:
Current Iranian Military Status:
Strait of Hormuz Developments:
Iranian Claim:
Iranian state-controlled media (via Associated Press) reported that Iran had again closed the Strait of Hormuz, citing ongoing Israeli strikes against Hezbollah in southern Lebanon as the reason, and has stated that all ships passing through needed to be checked by Iranian officials, as mentioned above. Some U.S. media outlets are stating that the strait is largely blocked and Iran is demanding bitcoin for passage, adding to the confusion.
Related:
It was also announced that Vice President Vance will lead the Trump administration’s delegation in talks with Iran this weekend, meeting with Speaker of Iran’s Parliament Mohammad Bagher Ghalibaf.
What next? An article by the NY Times weighed in on this succinctly:
“White House officials say talks are expected to begin between the two nations on Saturday, brokered by Pakistan. They are likely to be contentious. Among other things in its 10-point proposal, Iran wants to maintain its control of the strait, the narrow passage through which a fifth of the world’s oil usually flows. Iran’s chokehold on it during the war has damaged the global economy. “It is very unlikely that Washington or Iran’s Gulf Arab neighbors would accept this,” my colleague Erika Solomon reports. Iran also wants Americans gone from the region. It wants reparations to pay for damages. And it wants the U.S. to accept Iran’s right to enrich uranium. That’s not going to happen. The United States has bases across the Persian Gulf states, Israel and Iraq. The administration is unlikely to pay to rebuild Iran. And as for its nuclear ambitions, Secretary of Defense Pete Hegseth said at a news conference yesterday that the United States could send Special Operations troops to seize the fissile material. “If we have to, we can do it in any means necessary,” he said.”
I’m feeling a little broken record these days, but each month I cannot really think of any data points more necessary to monitor than these:
So I’ll roll through some updates that we should consider on each of these talking points.
Jobs
The March jobs report just gave the Fed permission to: do nothing. The US economy added 178,000 jobs in March, exceeding expectations of only 60,000 jobs. The unemployment rate ticked down to 4.3%. However, downward revisions were made for February, but revised up for January, which makes me wonder if March will be revised in the future as well. Wage growth slowed overall but average hourly earnings still rose by .2%.
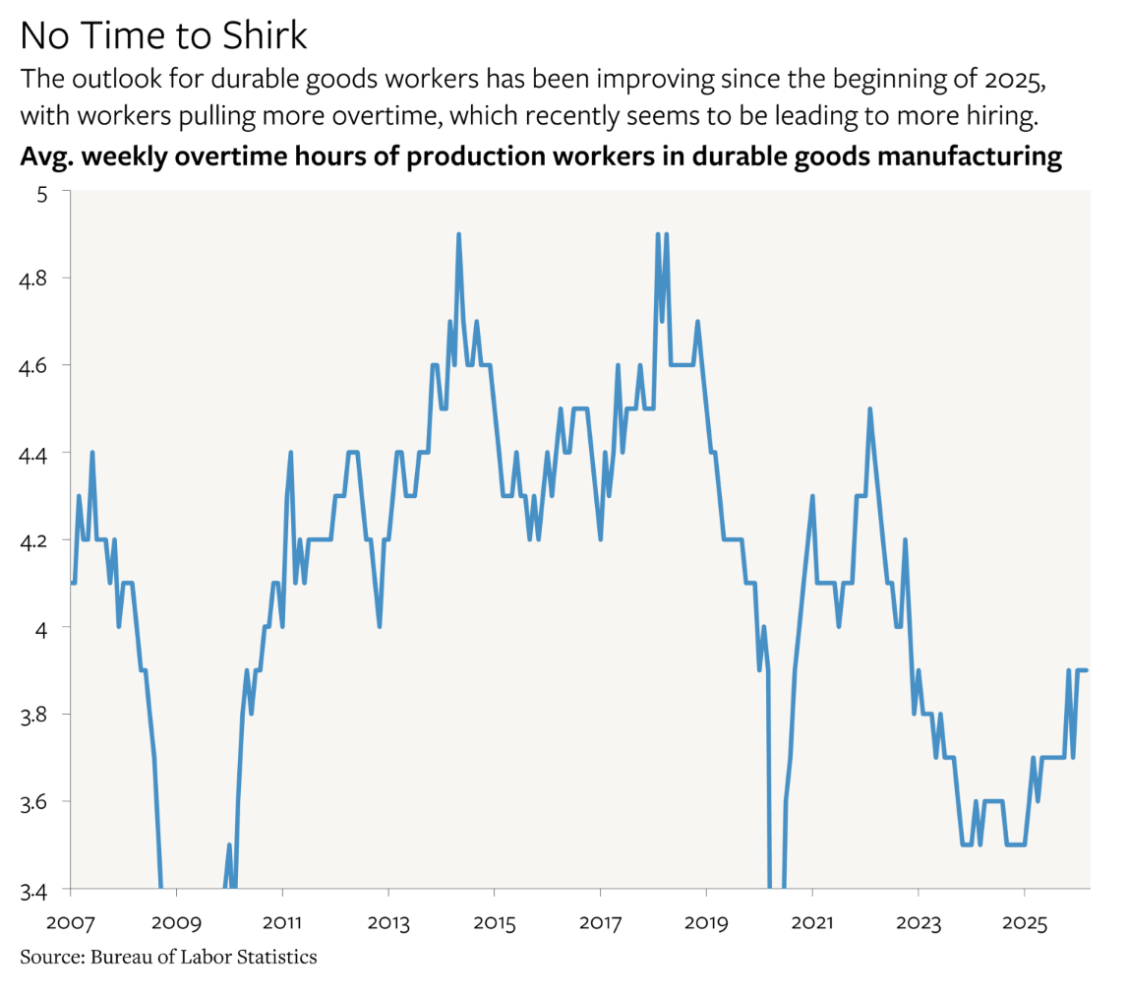
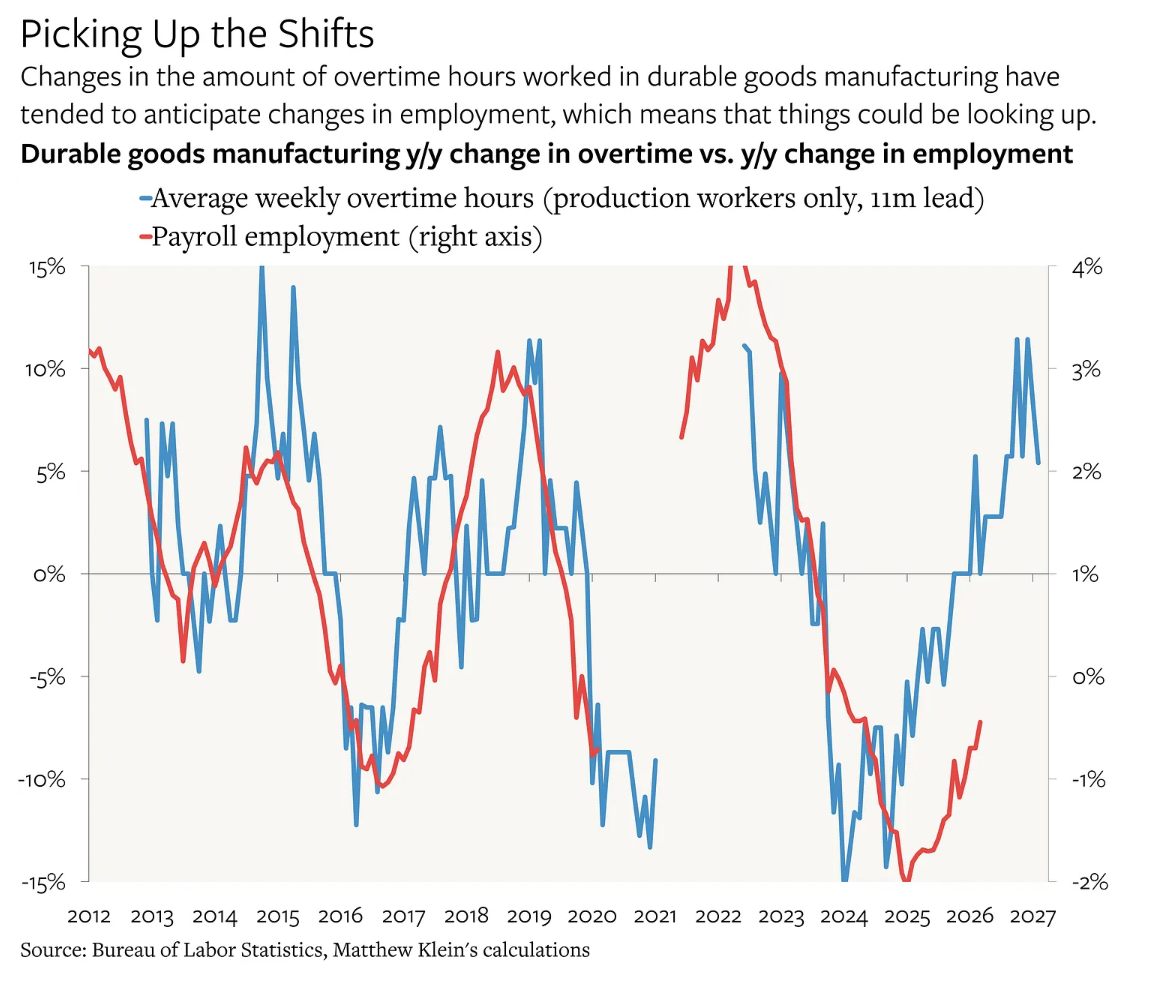
Meanwhile, durable goods manufacturing seems to have either bottomed out, after falling steadily since the end of 2024, or may even be rising again. Consistent with this, overtime hours for workers in durable goods manufacturing have been rising since the beginning of 2025, and are now at their highest since the end of 2022. That said, overtime hours remain far lower than in 2021-2022, much less the pre-pandemic period.
Matthew Klein is one of my go to economists when it comes to the labor market and jobs data. His new piece on the most recent jobs data is full of great insights, but I’ll summarize what I pulled out of it as most pertinent to our discussion.
Inflation
The FED sounded decidedly more hawkish during their most recent meeting, citing inflationary pressures remain too elevated to cut rates, and even stating rate hikes could be necessary to tame inflation if it does not begin cooling again. Thankfully, the latest inflation data for March came in better than expected. Assuming oil prices do not increase dramatically due to a prolonged Strait closure, there could still be a chance for at least one rate cut in 2026.
However, even prior to the Iran War, inflation was still above the Fed’s target of 2% and had not been showing evidence that it was tamed yet. So simply ending any conflict in the middle east also does not guarantee us that the battle against inflation will be over.
The first inflation reading following the start of the conflict reflected a sharp rise in energy prices, with the energy index posting its largest increase since 2005. Headline CPI rose to 3.3% in March from 2.4%, as the gasoline index surged 21% month-over-month, the largest increase since data collection began in 1967. Encouragingly, core inflation rose less than anticipated, increasing 2.6% year-over-year. The supercore index—which tracks services inflation excluding housing and is used to gauge underlying labor‑intensive services inflation—slowed to its weakest monthly pace in eight months. While there will likely be a lag before elevated energy prices filter through various sectors of the economy, we believe today’s data pushes back against the Fed’s rate‑hike narrative. Under our base‑case scenario where oil prices start to slowly normalize, we expect the Fed to cut rates once in the back half of the year, which should help reinforce recent stabilization in bond yields.
Diane S. offered up two likely scenarios she sees as possibilities depending on the length of the closure of the Strait of Hormuz:
Scenario 1: Inflation expectations remain well-anchored, while the margin compression associated with higher energy prices undermines the labor market. The Fed resumes rate cuts over the summer and ends the year with the fed funds rate in the 3.0-3.25% range, which the Fed considers neutral. Scenario 2: Inflation expectations become unmoored, stagflation begins but the Fed raises rates to counter it this summer. Rates stay higher for longer; cuts resume in mid-2027.

Manufacturing
Last week, both U.S. retail sales and ISM manufacturing data came out above expectations. The retail-sales figure for February showed retail sales excluding autos advancing by 0.5% monthly, above forecasts of 0.3% and last month's flat reading. This points to a U.S. consumer that continues to spend at a healthy rate, heading into the Iran crisis. Meanwhile, ISM manufacturing for March came in at 52.7, above forecasts of 52.3, and still indicating expansion in the U.S. manufacturing economy. This is the 3rd month of an expansionary reading (over 50), momentum that hopefully does not slow down in coming months as manufacturing looks to make a comeback. Also important to note is that New Orders are in expansion territory, backlogs of orders are shrinking, and inventories are shrinking as well. Ask yourself, what industries is your business most exposed to? From the ISM PMI Report:
“The 11 manufacturing industries that reported growth in new orders in March, in order, are: Printing & Related Support Activities; Primary Metals; Nonmetallic Mineral Products; Transportation Equipment; Wood Products; Fabricated Metal Products; Computer & Electronic Products; Machinery; Chemical Products; Electrical Equipment, Appliances & Components; and Miscellaneous Manufacturing. The three industries reporting a decline in new orders in March are: Furniture & Related Products; Plastics & Rubber Products; and Food, Beverage & Tobacco Products.” - ISM PMI Report
FED
As you may have noticed all of these economic data points are very closely interconnected, so we've already mentioned the FED in almost each of the above sections. The last think I wanted to add was from an article I appreciated by Gregory Daco on the Fed’s next decision.
“The Fed is expected to signal that the next move in rates could either be up or down when it meets later in April. New Fed Chairman Kevin Warsh is expected to push for rate cuts to blunt the blow of the war - his colleagues will want more progress on inflation. We have tentatively penciled in two rate cuts by year-end, but the risk of repeating the mistakes of the 1970s will hang heavy over a decision to cut. Stimulus mixed with repeated supply shocks contributed to the nightmare of stagflation."
Understanding where we go from here in the coming months is going to primarily depend on the logistics of global oil supply. The longer oil supply is constrained, the greater the impact on global economies, the US included. In the meantime, let's continue to hope for increased activity in domestic manufacturing, and a continued strength in consumer spending. Something we did not cover today that will need revisiting maybe next month is US Single Family Home sales and starts. Home starts have shown promise so far this year, but home sales are still suppressed. As long as interest rates remain high, they seem to be a barrier for increased housing activity and the freight volumes they drive.
It is difficult to say right now if truckload rates have changed meaningfully outside of normal seasonality and the dramatic increase in fuel costs. I enjoy the work of David Spencer and his team in Arrive's monthly market report. Understanding the supply dynamics will be increasingly important the more disruption the market experiences. The latest Arrive report had this to say about supply:
Key Takeaway: Capacity remains constrained by high operating costs, tightening driver supply and ongoing regulatory enforcement. The Details: Carriers relying on spot freight are facing increased financial strain as all-in rates lag rising fuel prices. Tender rejections reached multi-year highs in early March as produce season ramps up across key regions. Driver availability has tightened significantly in recent months. What's Next: Supply is likely to tighten further as seasonal demand builds through April and May. Fuel prices will continue to play an important role in attrition rates, and current equipment trends suggest supply is unlikely to expand in the near-term.
And their high level thoughts on rates:
Key Takeaway: Rising fuel costs are pushing all-in contract rates higher, while fuel-related spot rate increases are playing out over a longer timeframe. The Details: Flatbed markets remained historically elevated amid seasonal tightness and post-storm recovery volumes. Reefer rates softened outside of key produce regions. What's Next: If elevated fuel prices persist, spot rates are expected to rise alongside increased seasonal demand.
jAnd lastly, a look at some rate charts to help better understand spot and contract rates as of early April.
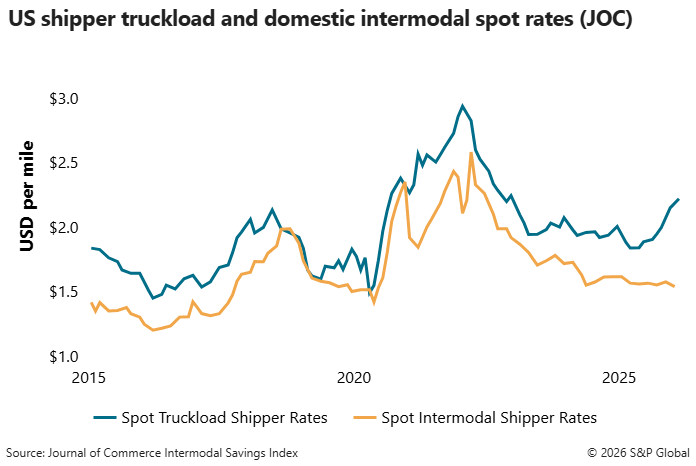
According do the Journal of Commerce Intermodal Savings Index:
Starting in May 2025, truckload spot rates began rising and have jumped significantly since December. Railroads have not yet raised spot market pricing to use intermodal, providing record-high comparative savings for shippers, for now.
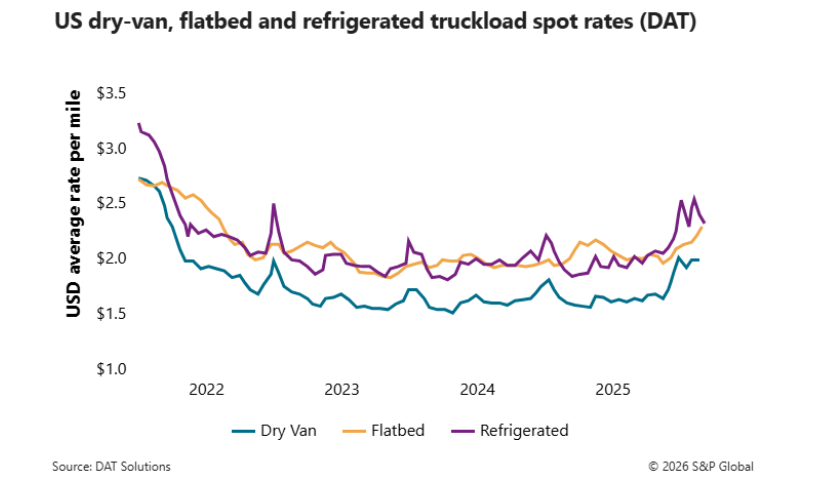
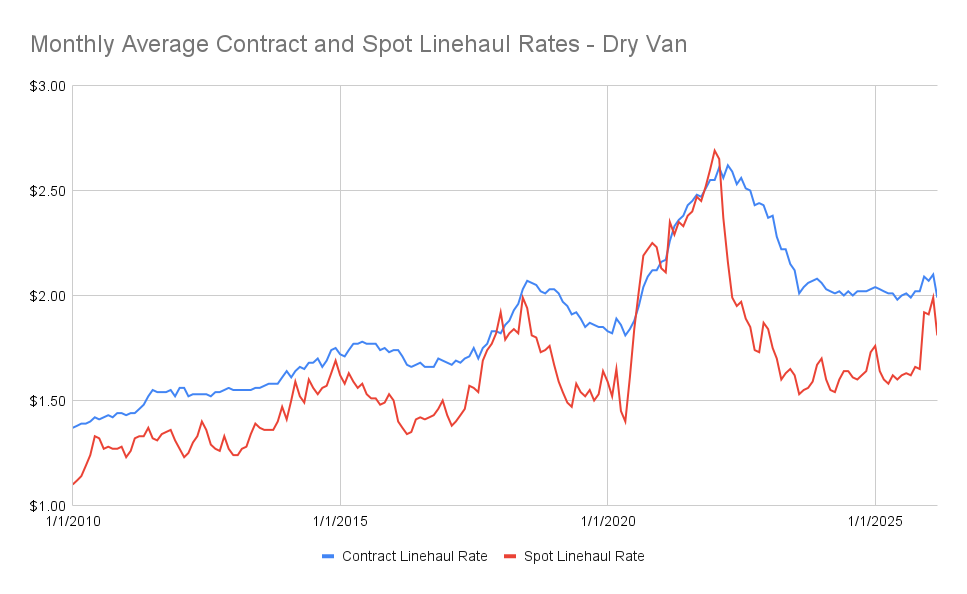
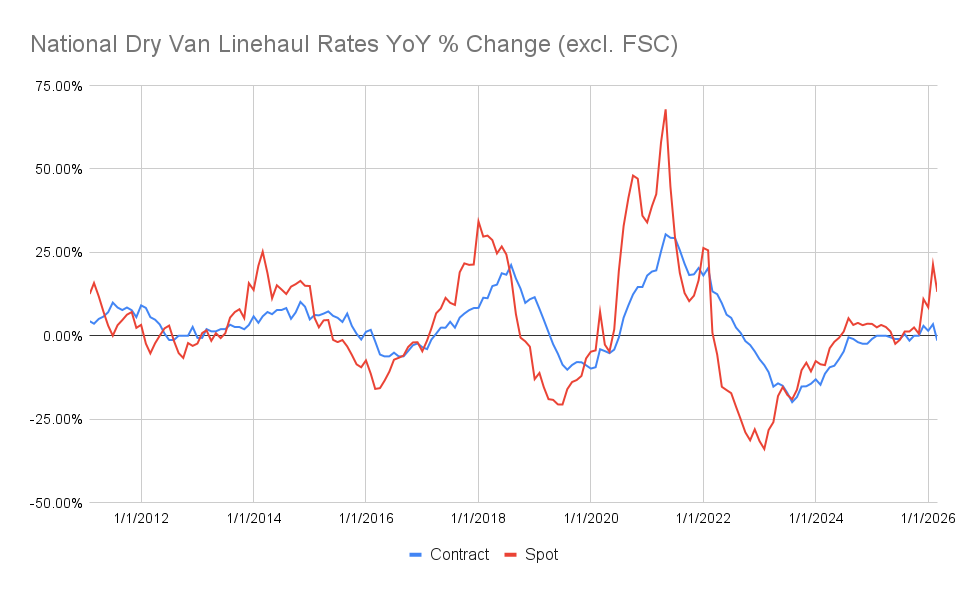
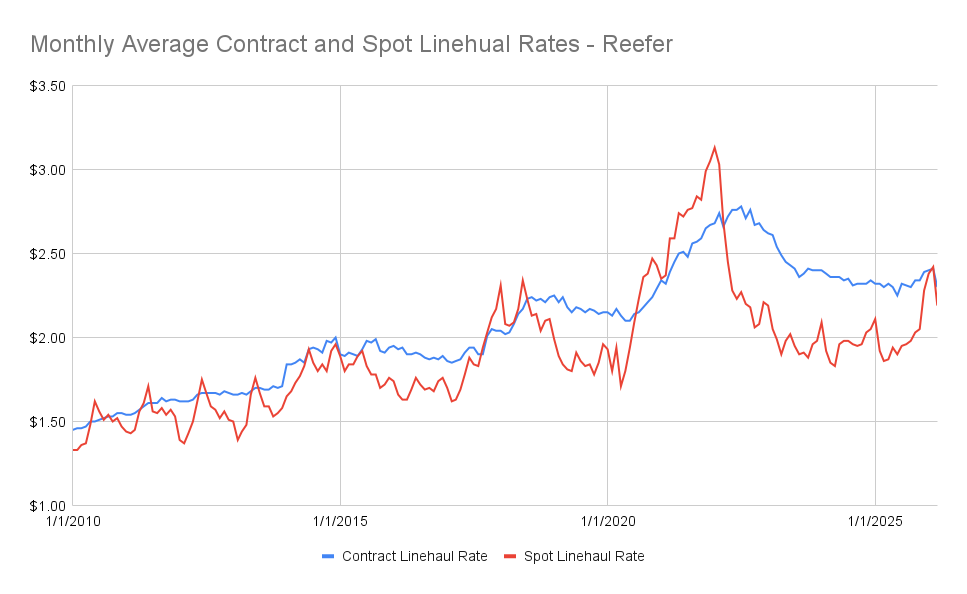
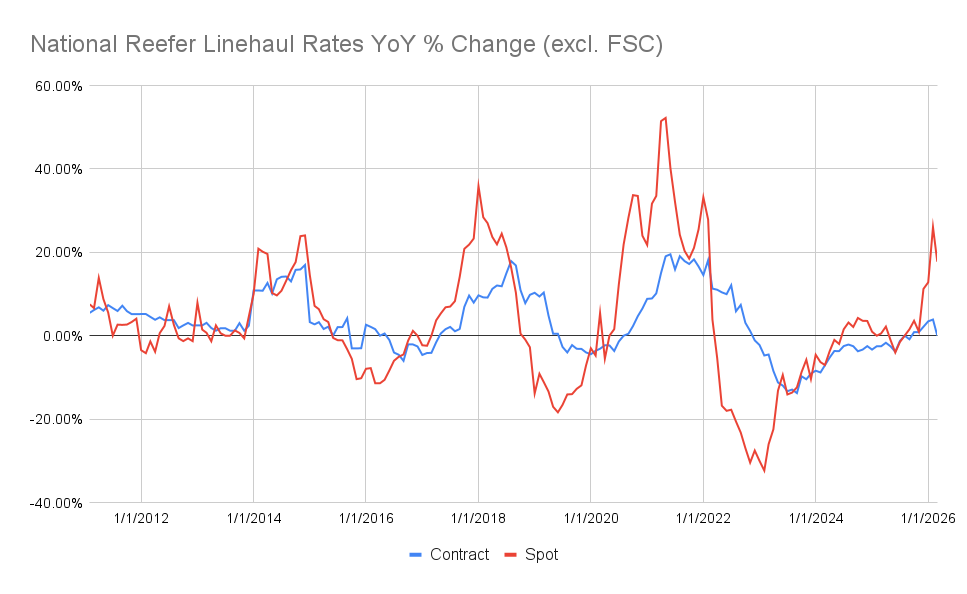
Monthly Charts Provided by DAT:
Remember when viewing these charts that they are linehaul only, stripping out the current fuel volatility.
Meet Me For Coffee with Samantha Jones seeks to correlate macro-economics to freight markets (just like this Newsletter does) and offers a chance to hear various industry and non-industry experts explain their thoughts on economics and freight markets.
Check out our Podcast Channels on your preferred platforms!

Thank you so much for reading and supporting the Truckload Market Update Report, produced by Samantha Jones Consulting LLC. Samantha Jones Consulting focuses on helping companies in the logistics industry better brand and sell their services to create sustainable revenue growth, and support their company growth goals!
We love Feedback, if you have questions, comments, suggestions, or are interested in sponsorships or partnerships, please email samantha@connectsjc.com to connect!
Make sure you subscribe to the Newsletter to receive the monthly update, and please share this with a friend who can also benefit from reading! As always, Samantha's work is free and created with the intent to add value to the transportation industry.
