

Yet again, the headline story this month should be about truckload rates, and we will get to them. But first, another moment to take a high level look at the economy, and signals we should be mindful of.
Q1 earnings have wrapped up, and corporate profits boasted one of the best readings since the post pandemic rebound in 2021.
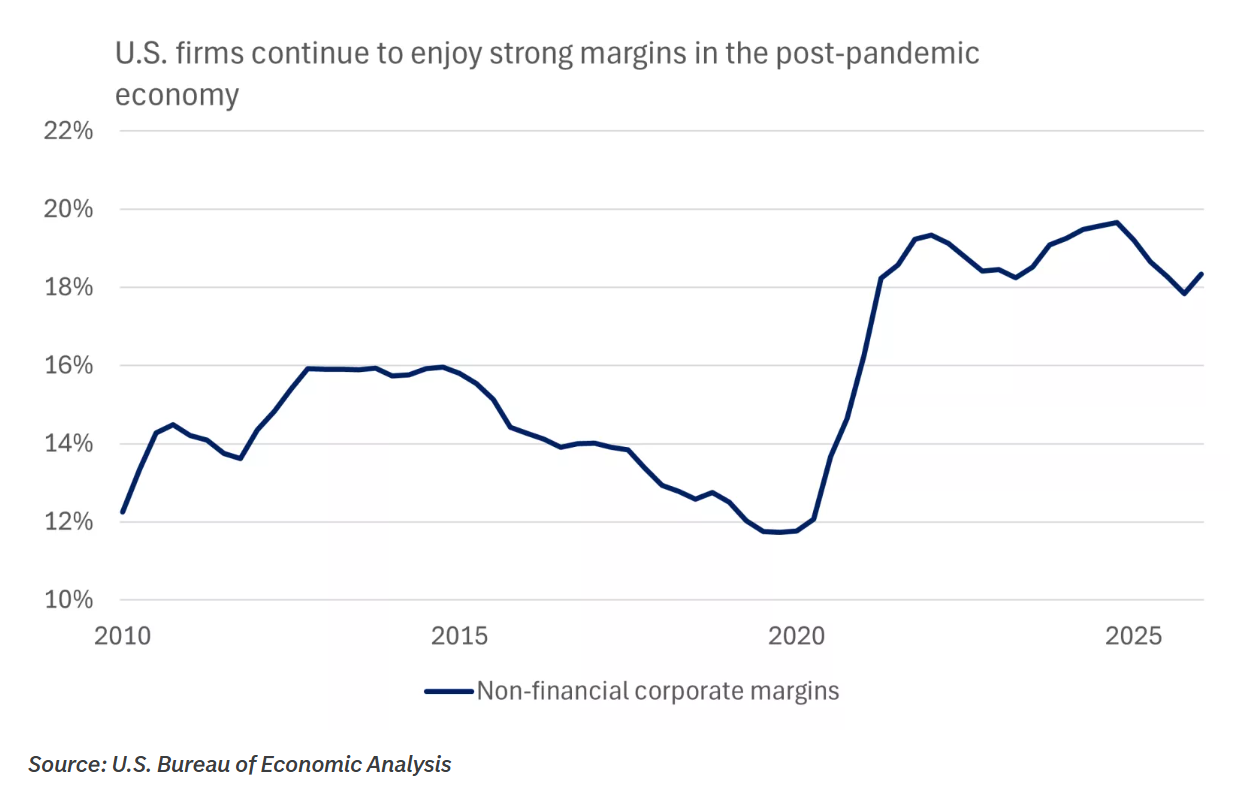
National accounts data include a wealth of information on income flows across the economy, including corporate profits. There are important differences in the calculation of GDP profits and the earnings reports we read for listed companies, and these data look at all companies, as opposed to just listed names. However, this broader measure can be a great cross-check on corporate profitability. Q1 profits were up 3.8% annualized, at first glance not a particularly impressive gain. However, quarter-to-quarter we tend to see a good deal of volatility in profit growth, and it is better to look at the change over the past year. On this front the signal is more positive, with profits up 12%, the best reading since the post pandemic rebound in 2021 and mirroring the strong readings in Q1 corporate earnings reports. Strong margins are helping underpin these earnings. Domestic non-financial corporate margins stood at 18% in early 2026 according to the latest GDP data, near post-Covid highs and comfortably above those seen before the pandemic.
At first glance, this is an encouraging development. Economic growth and expanding GDP are generally positive indicators. However, this growth is occurring alongside deteriorating consumer sentiment and persistent inflationary pressures, underscoring the importance of maintaining a balanced view of both opportunities and risks.
One perspective that has resonated with me recently comes from David Kelly's discussion of a "divergent economy." His premise is that the economic experiences of higher- and lower-income households are increasingly diverging, creating materially different outcomes across industries and sectors. I came across a subtitle this week that stated, "The headline can be right and still mislead you," and that observation feels particularly relevant in today's environment.
Consider consumer spending. Higher-income households continue to spend at a healthy pace, while lower-income consumers are becoming increasingly cautious. Aggregate spending data therefore remains constructive, but those headline figures can obscure growing stress within the lower half of what many describe as a K-shaped economy.
A similar divergence exists in consumer confidence. Sentiment surveys continue to register near historic lows, yet economic activity and consumer spending have remained resilient. While these data points appear contradictory, they are both accurately reflecting different realities within the broader economy.
Consumer discretionary manufacturers may be among the sectors most exposed as inflationary pressures persist into the second quarter. Whirlpool's recent earnings results offer a compelling example. The company is facing pressure from both sides of the equation: rising input costs and tariff-related impacts on components, while simultaneously contending with softer demand as consumers increasingly prioritize necessities, services, and experiences over discretionary durable goods.
Another dynamic worth monitoring is the relationship between wages and inflation. For the previous 35 months, real wage growth exceeded increases in consumer prices, providing consumers with meaningful purchasing power gains. That trend recently reversed, with both April and May showing wage growth lagging inflation. At the same time, any assessment of consumer spending health should also account for the seasonal support provided by tax refund distributions, which may be temporarily bolstering spending activity. David Kelly wrote,
Other areas of upper income spending, such as recreational goods and services, are continuing to show momentum. By contrast, real spending on food for home consumption fell by 0.2% in the year ended in April as weak demographics and now negative real wage gains drag on the spending of average American consumers. That being said, we will get some relief from an 18% year-over-year gain in total income tax refunds and we expect real consumer spending to grow by 2.2% annualized in the second quarter, before easing back to roughly 1.5% growth for the rest of 2026 and 2027.
Another important consideration for freight professionals in this divergent economy is the composition of spending. While residential homebuilding remains under pressure, investment in technology infrastructure has accelerated significantly.
There is some evidence of this shift in freight activity, particularly through increased flatbed and dry van volumes tied to large-scale data center construction projects. However, not all economic growth translates equally into truckload demand. High-growth sectors such as technology and services tend to generate fewer truckload volumes than goods-producing industries and domestic manufacturing.
This helps explain why freight markets have remained sluggish despite record equity market performance and strong corporate earnings over the past several years. The economy may be expanding, but the areas driving that growth are not necessarily the same areas that create broad-based freight demand.
To wrap up his thoughts, David Kelly shared his view on the average path forward for the US economy amidst all the divergence taking place:
For now, this appears to be one of moderate GDP growth, slow job gains, a low and falling unemployment rate and inflation peaking this summer but falling back to a much cooler pace next year… This should result in year-over-year real GDP growth of between 2.0% and 2.5% for 2026 and between 1.5% and 2.0% for 2027. As we noted in a recent article, this pace of economic growth should result in steady employment gains of about 60,000 per month, a drift down in the unemployment rate to below 4% in 2027 and inflation falling back to a 2% year-over-year pace by next spring.
Manufacturing has been showing signs of revival. And for freight markets, we certainly hope they are indicative of a broad based manufacturing renaissance. I went to Jason Miller this month for his thoughts on the manufacturing data.
We have seen improved demand conditions based on ISM and Federal Reserve Bank manufacturing surveys, though new order growth is best characterized as limited (ISM) and modest (FRB) based on historical patterns.

Data center construction continues unabated. It is now 3.5x what it was in 2022 (just prior to ChatGPT becoming popularized)

The Institute for Supply management’s PMI index for May was a positive confirmation that things are trending in the right direction to support expansion in domestic manufacturing. New orders, production, employment, and even backlog of orders were all up.

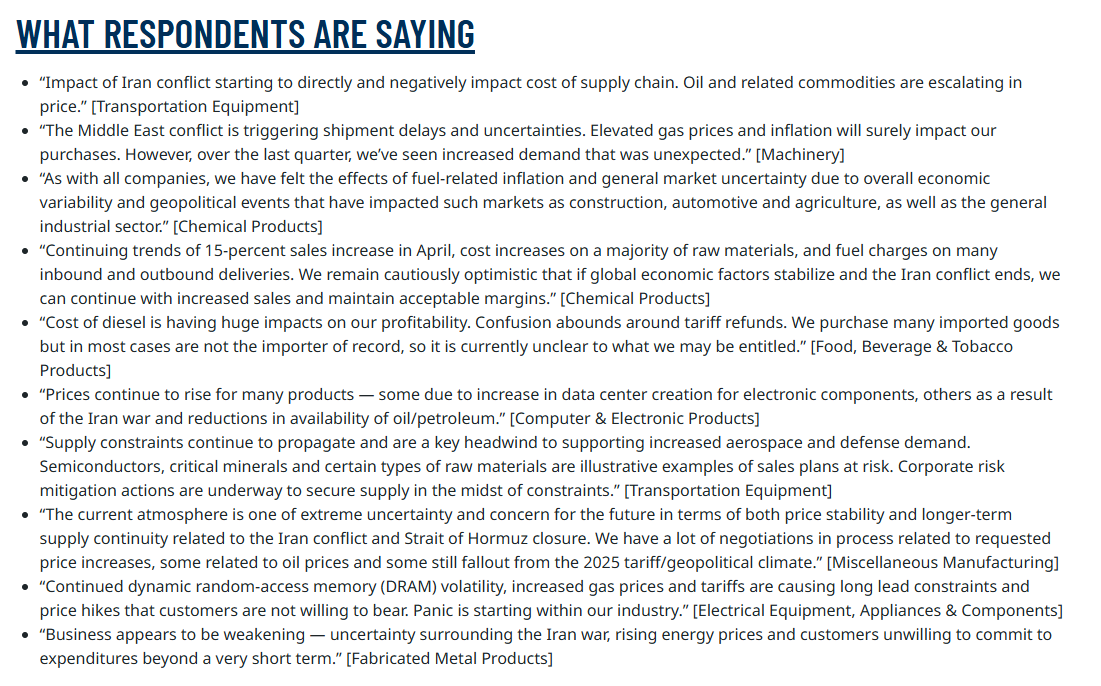
Not that manufacturing isn’t facing the potential for more headwinds to damper its growth. The longer the war in the Middle East drags on, the more risk manufacturing will face, both in the costs increasing for their own inputs, and in the demand decreasing as consumers and customers struggle with their own increasing costs to live or operate. Take a look at the comments that came along with May’s PMI report:
Inflation remains one of the most critical economic data points to monitor for us freight market professionals. And when it comes to understanding inflation, my go to resource is Matthew Klein ’s in depth analysis.
But the most important thing to understand about U.S. inflation is that the prices of locally-produced services continue to rise about 1-1.5 percentage points faster than in the years immediately preceding the pandemic—and the pace has been accelerating over the past year. Even without the unwelcome “one-time things” pushing up prices, underlying inflation would still be just as far off from the Federal Reserve’s goals as it was three years ago.
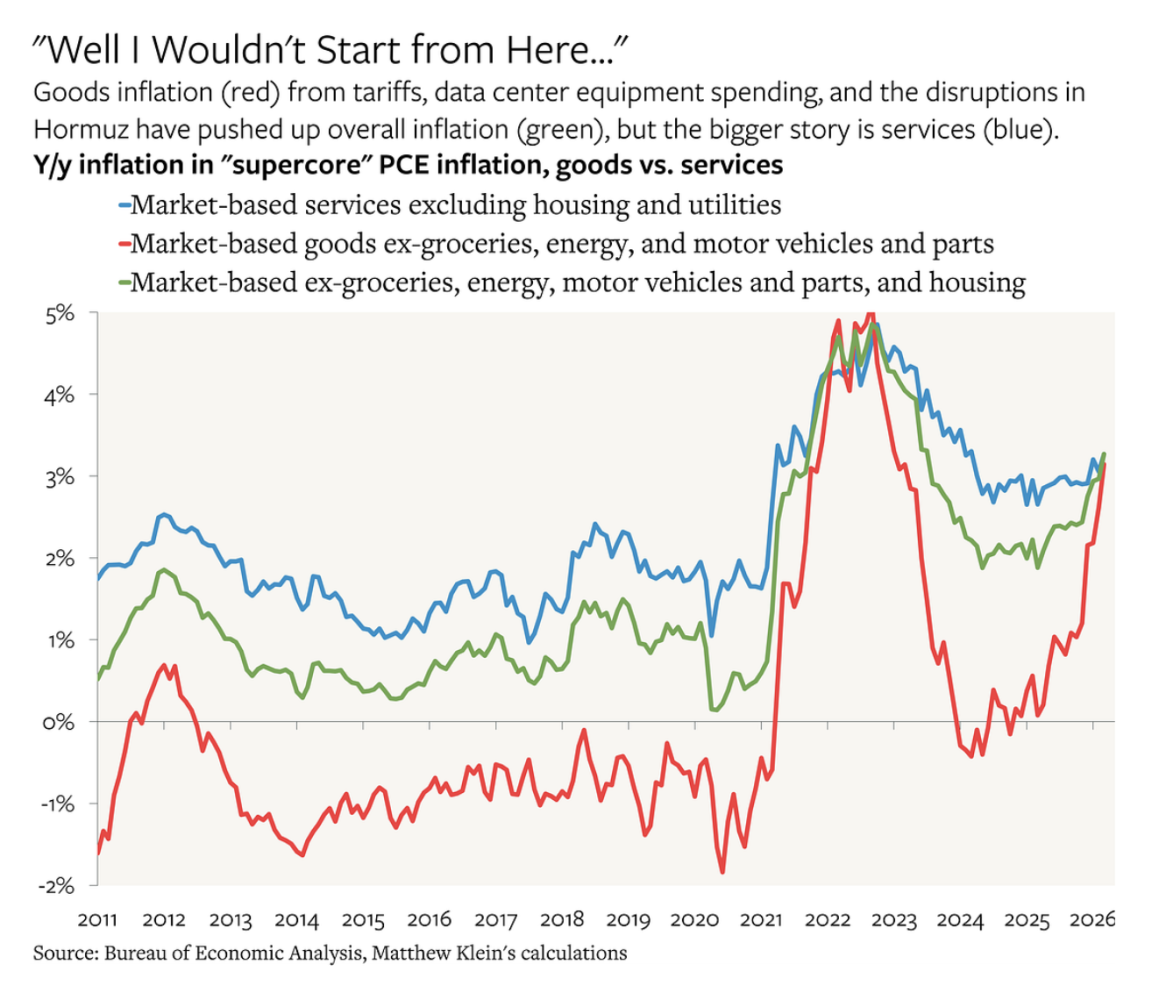
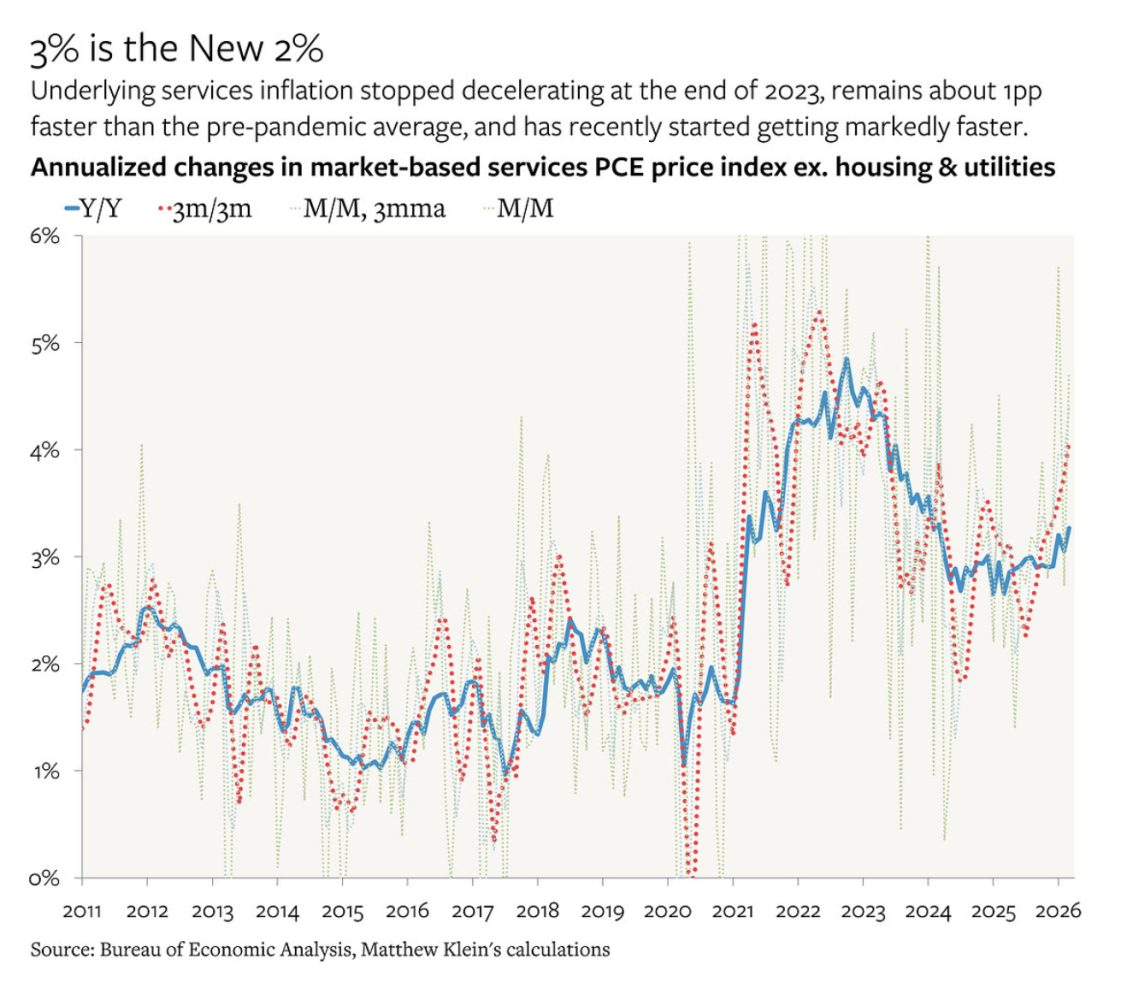
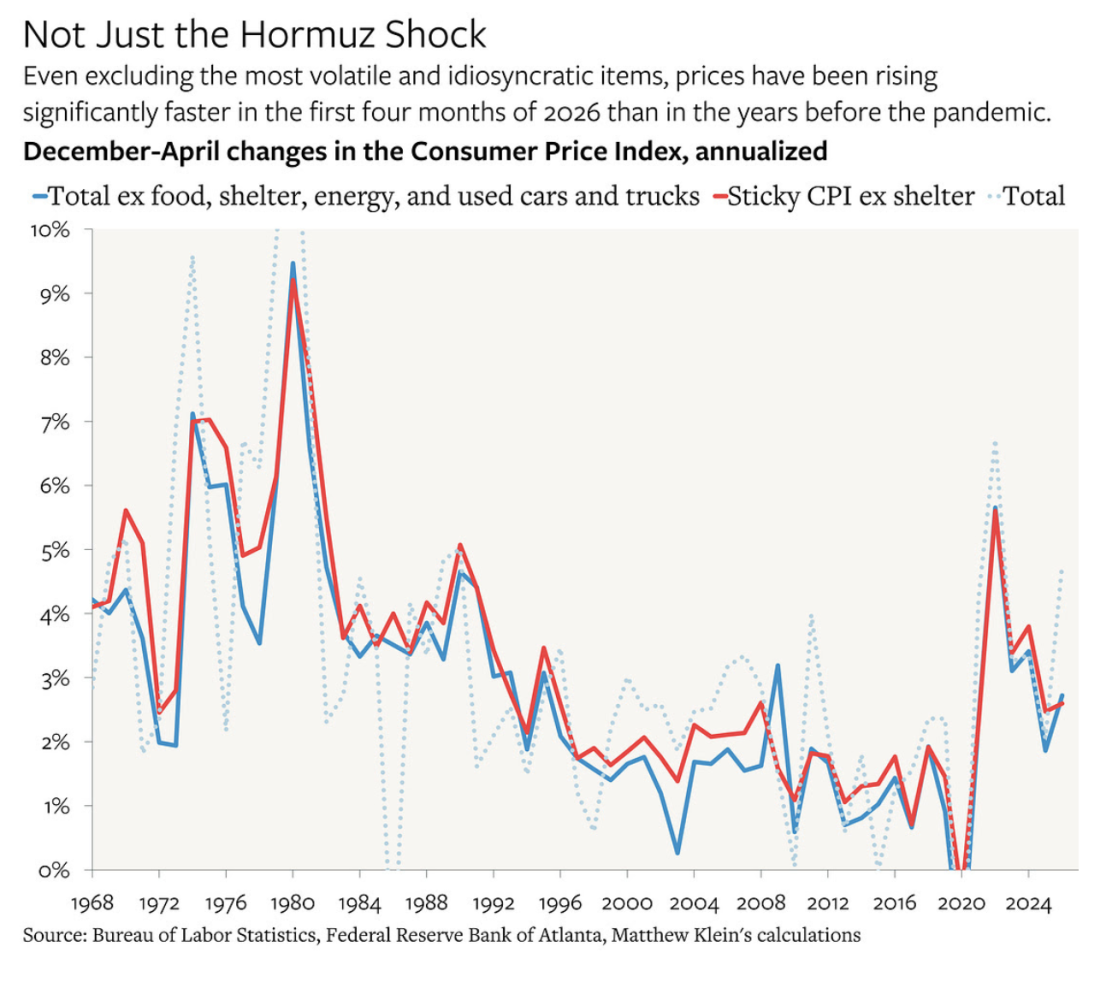
The most straightforward explanation is that U.S. consumers’ (nominal) purchasing power continues to rise quickly enough to cover both rising real demand as well as any price increases that businesses try to pass along. Despite Federal Reserve officials’ repeated insistence that they are committed to bringing inflation back to just 2% a year, there seems to have been a regime shift in the growth rates of (nominal) incomes and prices compared to the period before the pandemic. In particular, most measures of the average worker’s pay are still rising markedly faster than in the period immediately preceding the pandemic.¹ While that does not have to correspond to faster inflation, it usually does. This post-pandemic nominal growth regime has been sustained, in part, by the continued strength of the U.S. job market, which Fed officials have (justifiably) been unwilling to force into a downturn. Just as the dramatic headlines about goods-related inflation have obscured the more important story about services prices, the wild swings in net payroll growth over the past two years, which have largely been attributable to changes in immigration policy rather than changes in cyclical conditions, have obscured the more important stability in the proportion of Americans aged 25-54 with a job.
James McCann, Senior Economist at Edward Jones, also weighed in on inflation this week.
The personal spending deflator, the Fed's preferred measure of inflation, spiked to 3.5% over Q1as a whole. Worse, monthly data showed that this jumped even further in April, to 3.8%, and we expect another nudge higher in May.
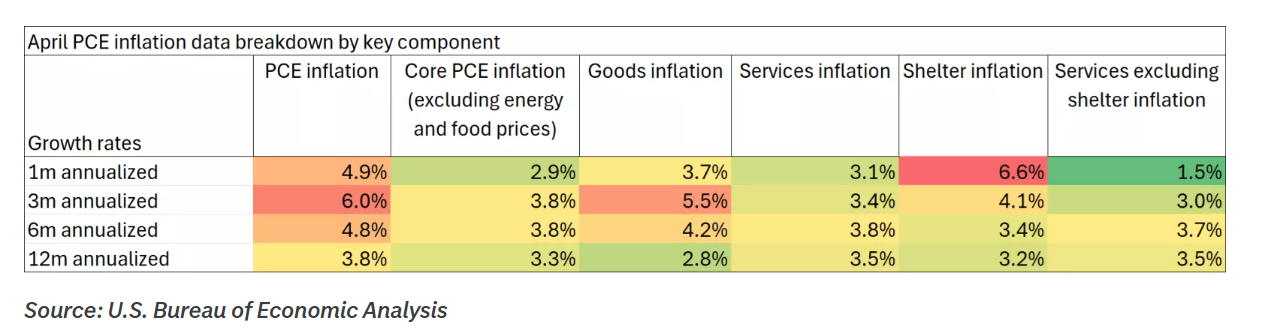
Some of this is an oil story, as gas prices push inflation higher. However, excluding energy prices, inflation was running at 3.3% in April, well above the Fed' target for 2%. Scratching further beneath the surface, core goods prices are running unusually hot at 2.8%, while core services inflation remains elevated at 3.5%. These data put the Fed in a tough spot and it is interesting to see markets continue to price a hike within the next year, even as risk around oil prices seemingly ease. We think the bar for raising rates remains high, and don't expect tighter policy unless we see signs of a further pick-up in price growth, particularly on the core side. Instead, we expect the central bank to stay on hold absent any growth scare.
The outlook for interest rates remains challenging. The probability of near-term rate cuts appears increasingly limited, which continues to weigh on interest rate-sensitive sectors such as housing and commercial real estate. Moreover, the longer inflationary pressures persist, the greater the risk that policymakers may need to consider additional rate increases over the next year rather than the easing cycle many market participants had anticipated.
That said, there are reasons for cautious optimism. Pressure continues to mount globally to restore stability to energy markets and reopen critical trade flows through the Strait of Hormuz. A resolution that alleviates disruptions in global energy supply could help reduce some of the inflationary pressures that have emerged since the conflict began.
Prior to these developments, inflation remained above the Federal Reserve's 2% target but had largely moderated to levels that were not materially weakening the labor market or creating meaningful upward pressure on interest rate expectations. Should energy-related inflation begin to recede, policymakers may find themselves returning to a more balanced environment, one where inflation remains elevated but manageable, and where additional rate hikes are no longer a growing concern.
As we shift into the discussion around freight rates, it’s important to note that when rates are elevated to this extent, it’s not just trucking markets that care. The transportation of goods is a major contributor to the costs of goods. It’s actually a measurable economic data point. As Jason Miller pointed out
“The incredible increases in trucking prices, which have soared 15% year-over-year as of April's PPI, could ultimately help undue this bull market pricing cycle because core services inflation of this sort is what makes the FOMC more likely to raise interest rates.”

Arrive Logistics' most recent Market Report, produced by David Spencer and team provided several Key Takeaways critical to understanding the current rate/volume environment:
Triumph released some rate insights this month, clearly depicting the record high increases in truckload modes across the board. Which begs the question, what is driving this market shift?

The increase was broad-based across equipment types. Van rates rose 8.9% month over month, reefer increased 8.3%, and flatbed led at 9.2%, following an already strong 13.4% gain from April to March 2026. Several forces converged at once: DOT Blitz Week, the start of trucking’s seasonal peak, and continued capacity exits. As a result, van rates are now up 40.0% year over year, reefer is up 36.0%, and flatbed has reached 41.9%.
This does not appear to be primarily a demand story. Rather, it appears to be a story of mounting pressures on supply.
The carrier market continues to face increasing pressure from regulatory enforcement, rising operating costs, record-high fuel prices, and other structural challenges. I spoke with a carrier this week whose insurance premium increased 250% from 2025 to 2026. Remarkably, that was the lowest quote they received among several options. Their safety scores were strong, and they had not filed a single claim during 2025. In fact, they chose to pay several incidents out of pocket specifically to avoid additional premium exposure. It appears that made little difference in the end.
Without getting into the driver shortage debate, the sentiment among carriers is that hiring experienced drivers remains extremely difficult. Competition for talent is intense as fleets attempt to position themselves for a strengthening market. However, for every driver one fleet hires, another fleet likely loses one. Rather than seeing a significant influx of new drivers entering the industry, much of the market appears to be reshuffling existing capacity.
Taken together, these supply-side pressures, combined with normal seasonal freight patterns, are contributing to upward pressure on rates.
From my perspective, two potential scenarios could unfold from here.
The first is that freight demand does not experience any meaningful acceleration, while carriers, encouraged by recent rate improvements, continue adding drivers and equipment to their fleets. In that scenario, enough capacity could re-enter the market to cool conditions and moderate rate growth once again.
The second is that supply fails to keep pace with demand. The barriers to entry for trucking fleets are significantly higher today than they were in previous cycles, and the challenges associated with expanding capacity continue to increase. If those dynamics persist, additional pressure could be placed on available capacity and freight rates, extending the stronger phase of this market cycle for longer than many expect.
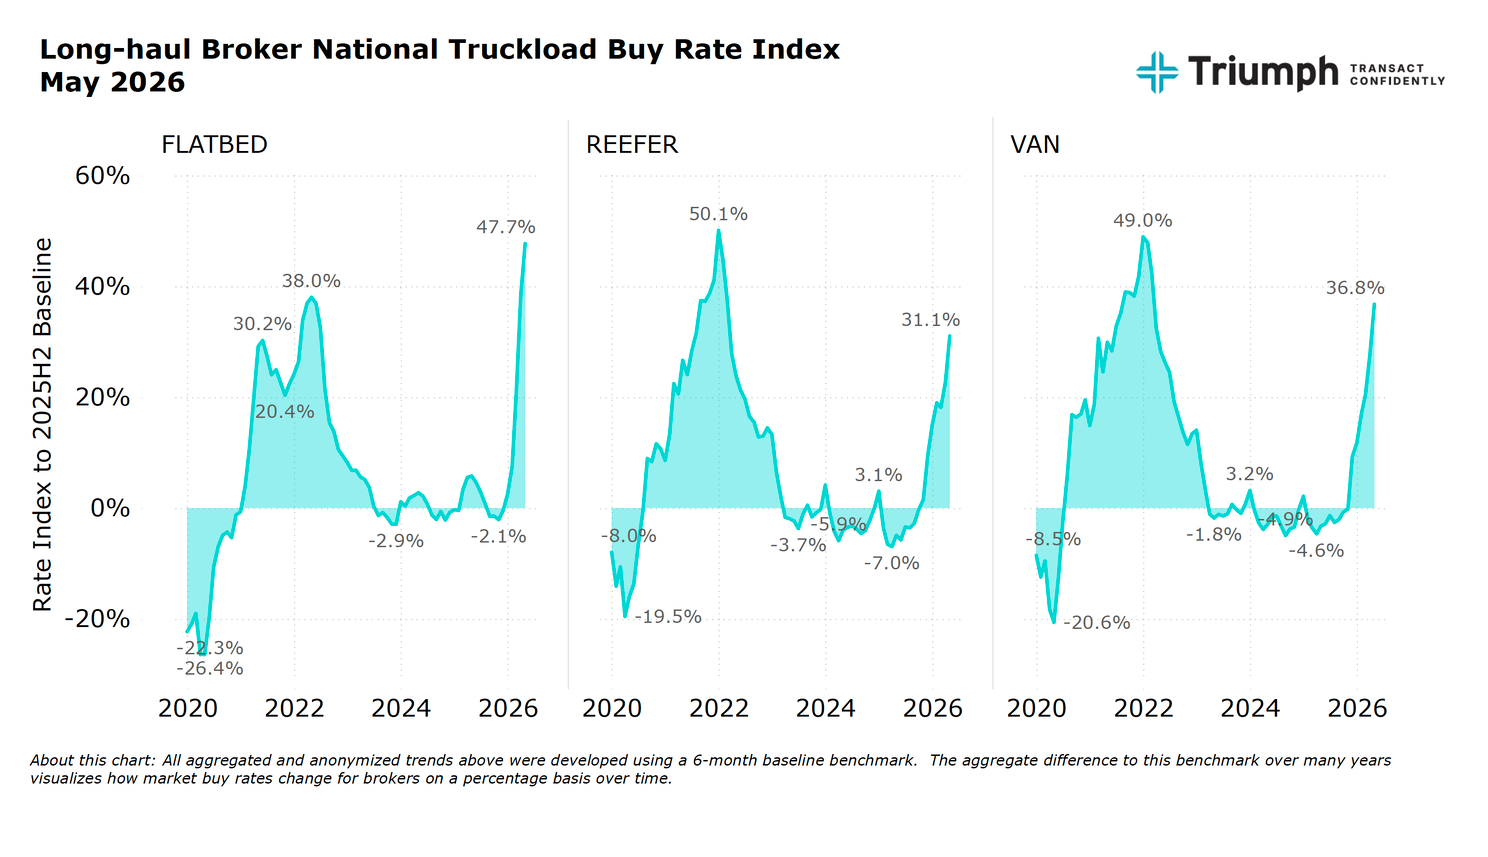
Regulatory compliance, insurance requirements, and operating costs continue to create meaningful barriers to re-entry. That gives the current rate environment more structural support than a typical seasonal surge.
And as is often the case in freight, all markets are not equal. Triumph reports that the Southeast is the hottest region by a wide margin.
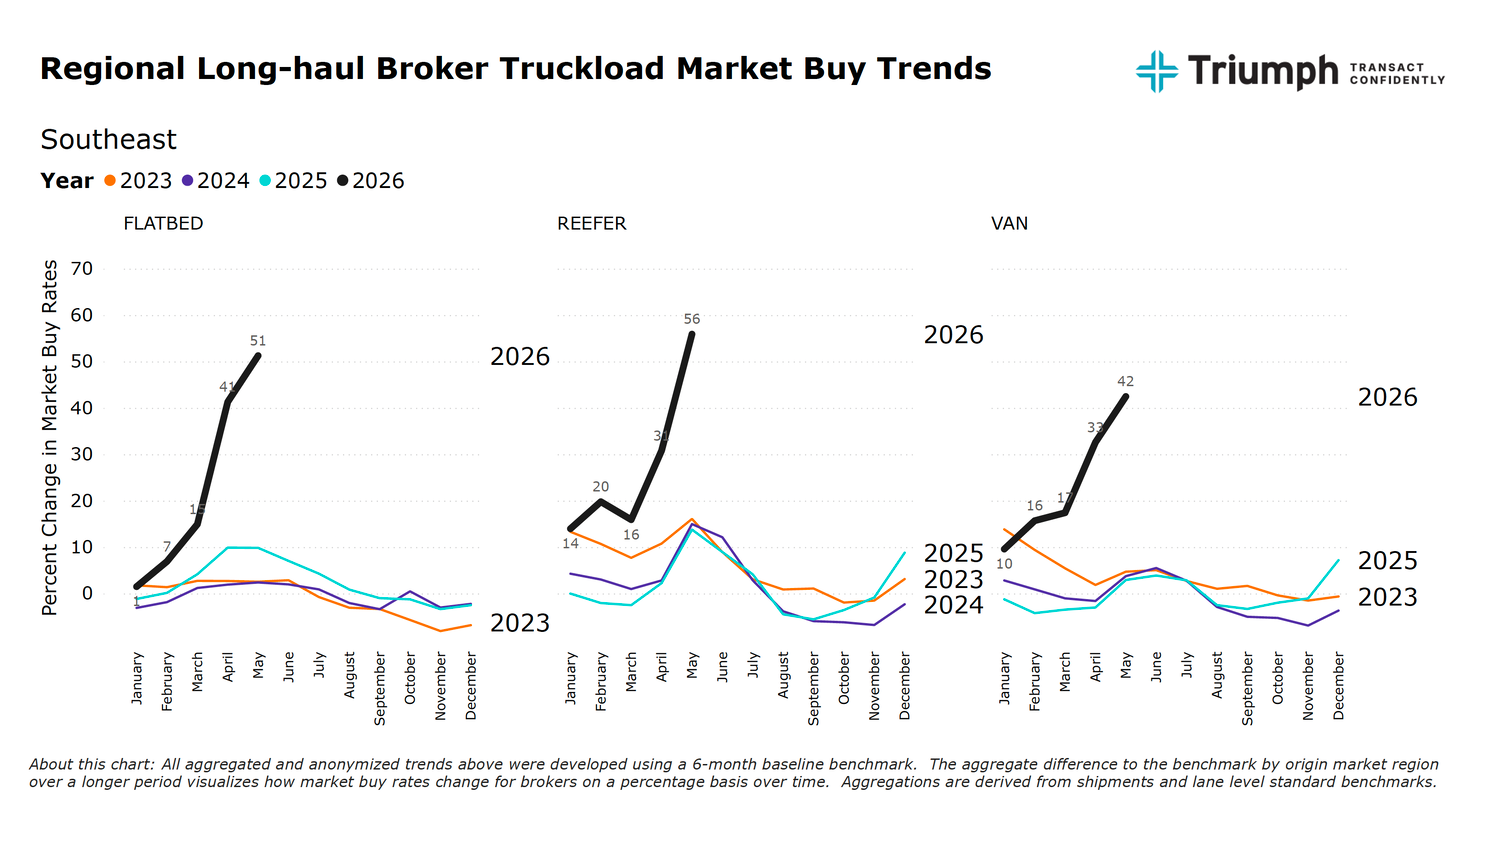
Regional variation remains significant, and it is shaping where pricing pressure is most intense. The Southeast leads inflation across all three equipment types relative to the second-half 2025 baseline: flatbed is up 51.3%, reefer is up 55.9%, and van is up 42.4%. By contrast, the Northwest remains the coolest regional market. That gap creates both risk and opportunity, depending on how a network is positioned.
Last month I featured the FTR heat maps for the first time in a long time, because they finally had a new story to tell. The maps do an excellent job of visualizing the dramatic change in rates the last couple of months, and regional pressures by mode.
For Dry Van
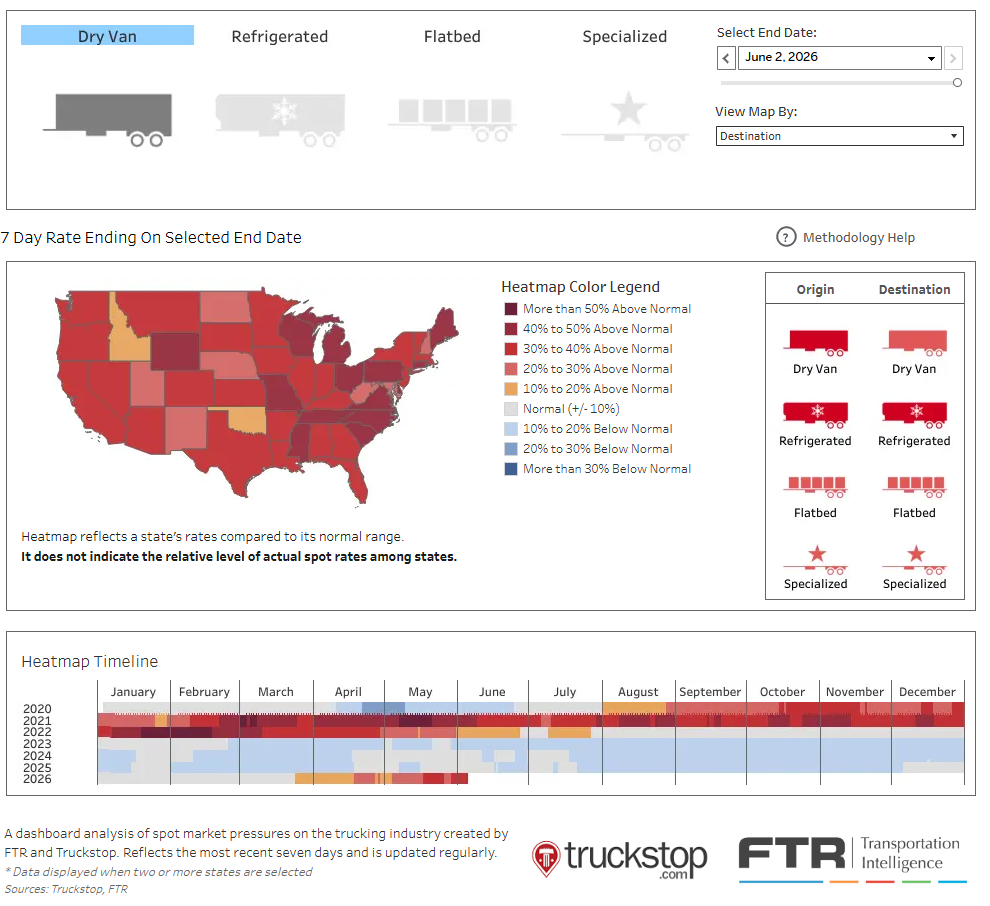
For Reefer

For Flatbed

To further support the idea that this is more a supply than demand driven rate increase, the heat maps for volumes are much less orange and red. Aside from flatbed. Flatbed volumes are showing gains.

And total spot rates (which include fuel) have set records lately.

Tender Rejection rates for Dry Van hit over 16% in May and Reefer rates hit over 20% according to Sonar. By far the highest numbers we have seen since the pandemic era. For this reason, I believe mid-contract rate negotiations are inevitable for most shippers. As carriers balance contract and spot exposure, and brokers begin struggling to honor contract rates at healthy margins in a rising spot market, conversations around rate increases are likely already underway and will continue through the end of the year.
Barring further supply shocks, and barring dramatic demand increases, it’s possible that after contract rates are renegotiated, things will settle in the market and resume the mark of normal seasonality. But, I’m unsure I could name a time in the last 5 years where we went more than a few months barring anything.
The next several months are likely to shape the next year for freight markets, we will need to be paying close attention.
Meet Me For Coffee with Samantha Jones seeks to correlate macro-economics to freight markets (just like this Newsletter does) and offers a chance to hear various industry and non-industry experts explain their thoughts on economics and freight markets.
Check out our Podcast Channels on your preferred platforms!

If you attend no other supply chain conference all year, you must at least attend Manifest Vegas . I have been partnered with Manifest for the last 3 years and I cannot encourage you strongly enough to ATTEND THIS CONFERENCE. There is truly something for everyone. Yes, I know February 2027 is still a long ways off, but it comes up quick! And, if you know you have to attend, you might as well take advantage of early bird rates while you still can! Get the cheapest tickets possible now, and an ADDITIONAL $200 off with my unique link! Details and discount here: http://manifestvegas.com/MeetMeForCoffee

Thank you so much for reading and supporting the Truckload Market Update Report, produced by Samantha Jones Consulting LLC. Samantha Jones Consulting focuses on helping companies in the logistics industry better brand and sell their services to create sustainable revenue growth, and support their company growth goals!
We love Feedback, if you have questions, comments, suggestions, or are interested in sponsorships or partnerships, please email samantha@connectsjc.com to connect!
Make sure you subscribe to the Newsletter to receive the monthly update, and please share this with a friend who can also benefit from reading! As always, Samantha's work is free and created with the intent to add value to the transportation industry.
