

The story remains mostly the same. Inflation is still tracking in the 2.5-5% range instead of the Fed’s desired target of 2%, and this is primarily supported by a personal wage income growth that is steadily running above a rate consistent with 2% inflation. Due to strong wage growth, consumer spending has shown strength, and even personal savings rates (primarily middle to higher income classes) remain strong enough to prop up consumer confidence in their spending. Manufacturing activity remains weak with September ISM numbers failing to provide bright spots, activity in the oil and gas industry has been weakening, and single-family housing permits have decreased recently alongside still elevated mortgage rates.
As we have covered many times throughout the course of this monthly update, domestic manufacturing activity is the largest contributor to truckload volumes. Because of that, a recent graph created and posted by Jason Miller on LinkedIn caught my eye. The graph showed the correlation between manufacturers’ backlogs of orders and dry van truckload linehaul spot prices. I was impressed with how closely they tracked. Considering backlogs are widely suppressed right now, it is unlikely that we see significant shifts in volumes until manufacturing activity and new orders begin to grow again.

Aside from the rather same-old-same-old topics I’ve just mentioned, a government shutdown is a new one. So, in today’s economics section of the report I’ll briefly cover the aforementioned topics, and cover what a government shutdown means for the economy.
Last week, the private payroll provider ADP reported a decline of 32,000 jobs in September, below economists’ expectations for an increase of 45,000. That also accompanied a downward revision to the August data from a gain of 54,000 to a loss of 3,000. Education and Healthcare, National Resources and Mining, and Information were the only industries that seem to have grown in September according to the ADP data, but we do not have full jobs data the BLS releases due to the government shutdown.
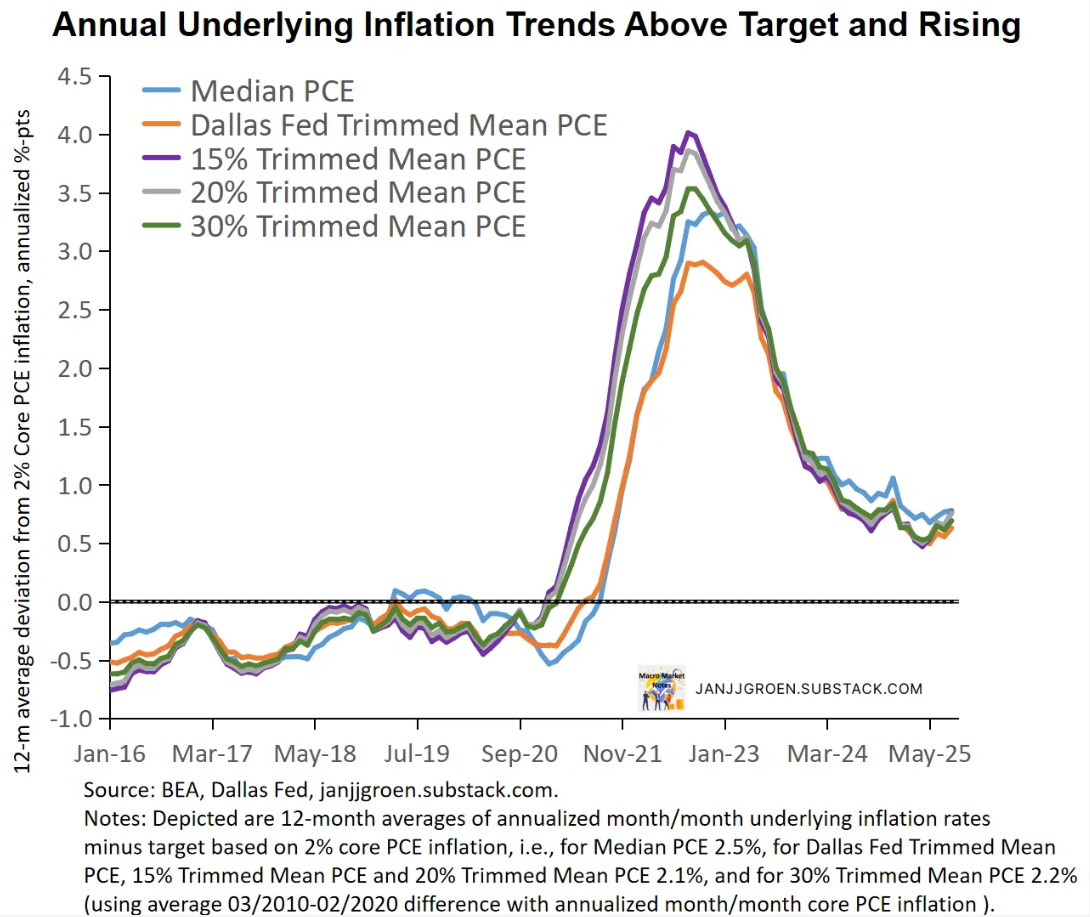
Jan J. J. Groen published the above chart with the following commentary,
“On an annual basis, 12-month average deviations of underlying PCE inflation rates relative to the inflation target in the chart above had been relatively stable until recently but accelerated somewhat in August. These suggest a longer-term pace in a 2.6%-2.8% core PCE inflation range.”
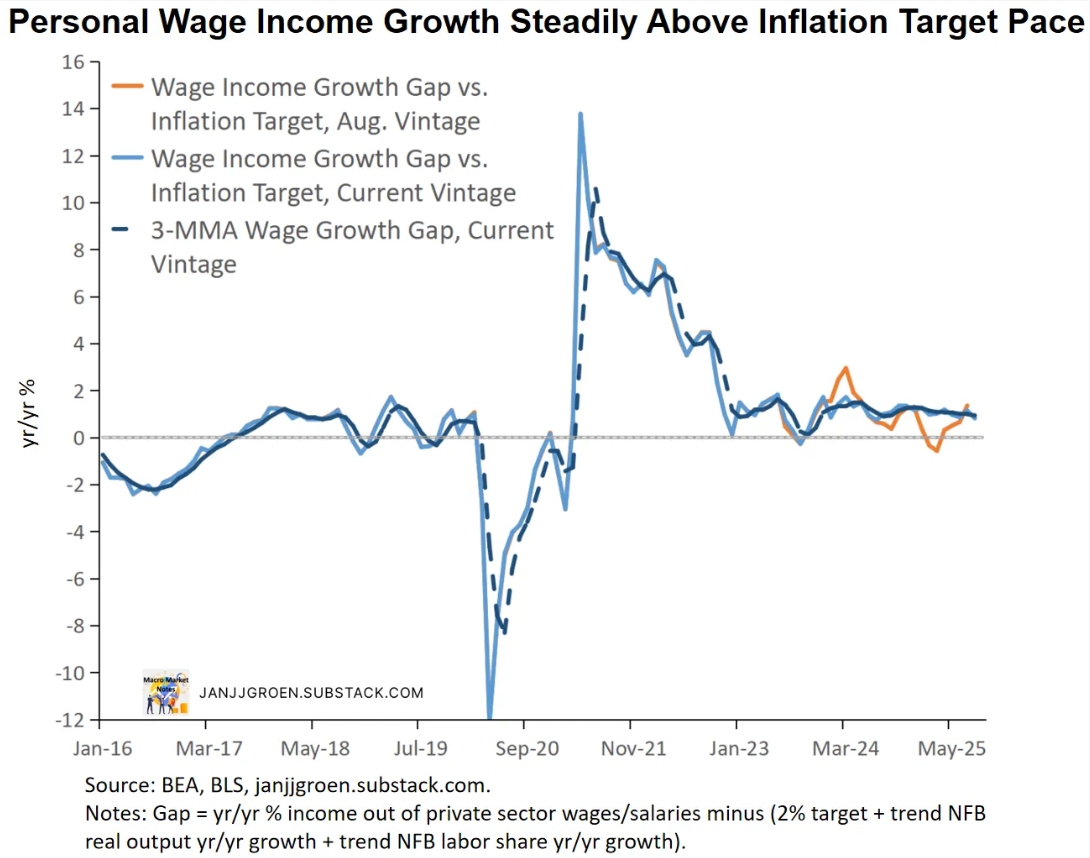
“The chart above compares today’s data vintage of household income growth out of private sector wages with the one from last month (pre-NIPA benchmark revisions). It shows that household wage income growth has been consistently outpacing inflation target pace by about 1 percentage point since early 2023 after the NIPA revisions (blue vs orange lines). Household wage income growth has been steadily inconsistent with a sustainable return of inflation to 2% and instead has been more consistent with a rate around 3% since 2023.”
Something I think we should all hold a strong curiosity about is the affects of AI on the US economy and labor markets. I think ultimately, it will take years for AI to reach it’s full potential for increased productivity, but some industries were early adopters of automation technology, and so we are starting to see the ROI adoption show up in hard data. Gad Levanon put together a great study recently on the potential effects of AI across the sectors that adopted it first, the question remains, will further adoption of AI across more industries have the potential to generate growth in labor productivity in sectors that have otherwise been stagnant? Can AI have positive impacts on industries like manufacturing? Especially in the face of reduced immigration, lower labor participation rates, etc? That remains to be seen, but it’s something I think I’ll keep an eye on in the years to come, and something that is already having a measurable impact in specific industries.
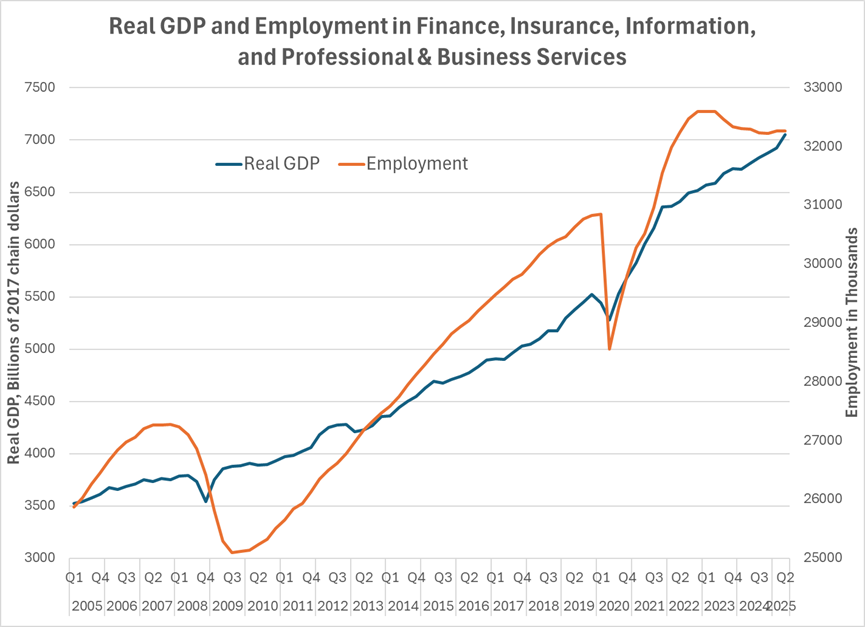
Gad published the above chart with the article that I found really interesting, and provided this commentary along with it:
“Let’s look at the striking trajectory of employment in FIIPB. This chart plots real GDP (left axis, 2017 chained dollars) and employment (right axis, thousands) for FIIPB from 2005 to 2025. Employment rises steadily for decades, with dips only around recessions. What’s new is the post-2022 break: employment has edged down from its recent peak even as real GDP keeps solidly growing. In other words, FIIPB is producing more with fewer people, consistent with the sharp productivity acceleration shown in the earlier charts.”
I read this line in an article this week while writing this market update, and gave it some pause: “The Fed continues to expect stagflation to be a feature of the U.S. economy in 2025.” I’m not so sure that the Fed expects it to be a feature as they are concerned with preventing stagflation. I think we are presently in a period of stagnation, but we are so far missing a core component to stagflation: high unemployment. Apparently this aligns with other thoughts out there, as I found an article published recently by Reuters literally titled “Fed’s fear meter may be pointing to stagnation, rather than stagflation”. In the article it says,
“There was even talk within the central bank and in financial markets of a risk of stagflation, a phenomenon marked by high inflation and unemployment and stagnant economic growth. It last reared its head in the U.S. in the 1970s and early 1980s. But data this summer has tended to ease that concern while raising uneasiness about the direction of the job market.”
Monitoring both inflationary data points and labor data closely as we move into 2026 will remain incredibly important. It appears the Fed is hoping tariff driven inflation is a one time adjustment we have to wait to measure the full effects of and be able to adjust to it, and that the labor market is cooling, but hopefully still stable enough to prevent rising unemployment and put some healthy downward pressure on the rapidly rising wages that have helped to support above target inflation.
As the U.S. is in week two of the federal government shutdown, financial markets remain largely unmoved. Stocks are hitting record highs, Treasury yields are stable, and volatility is low. Roughly 1.3 million federal workers have been affected. Contract workers face more lasting consequences, as they are not guaranteed back pay, and federal funding freezes for states and projects add further strain.
Beyond the immediate drag, the shutdown is also creating an information gap. Key data releases, like jobs and inflation reports, are on hold. This comes as the broader economy was already showing signs of softening. Job growth has slowed, tariff costs are rising, and immigration restrictions are tightening labor supply. Together, these trends could push GDP growth below 1% in the fourth quarter if the shutdown persists. The biggest threat at this time by the government shutdown is an increase in uncertainty at a time when we already have a lot of that, adding to the drag it has on the economy. On my podcast at the Inland Distribution Conference two weeks ago, Paul Bingham noted that an extended shutdown can cancel government spending activity that is typically not fully recouped after the shutdown ends.
David Kelly , the Chief Global Strategist at J.P. Morgan Asset Management had a great writeup on the effects of the government shutdown in his recent publication that would allow you to dive into further detail. (linked here)
A huge thank you to BiggerPicture for sponsoring this month's newsletter! BiggerPicture is focused on helping shippers, brokers, and carriers maximize their operational productivity, by reducing the time spent scheduling appointments by an average of 80%. Achieve full ROI in 3 months or less, and unlock new growth potential by shifting your most valuable resources (your peoples' time) where it can make the biggest impact.

If the government shutdown persists for weeks, we will continue to miss data releases, the same data releases that the Fed likes to cite in their policy decisions. This made me wonder, will the Fed be able to stay on track for more rate cuts if they don’t have the data to evaluate?
In researching this I found an interview between the Chicago Fed President Austan Goolsbee and an independent journalist I follow, Kyla Scanlon . Austan joined Kyla on her podcast on Friday October 3rd to discuss how the Fed can make decisions amidst a government shutdown, and he shared this about their Chicago Fed Labor Market Indicators, which is a data set the Chicago Fed has put together that is not reliant on the BLS data releases:
“Our data is not as good as the BLS. The BLS numbers are the best job numbers in the world but if we cannot have the best job numbers in the world, we are going to have to go with what we do have and what we have is this - based on what we know: Our real-time estimate is that the unemployment rate would’ve stayed the same at 4.3%. The hiring rate of unemployed workers went down a tiny fraction. It still remains basically 45%. The layoff and the separation rates are also very constant, just a little above 2%. So I feel like those numbers are showing the steadiness in the job market that is a bit in contrast to those monthly payroll numbers which are all over the map.”
He also said:
“And that said, I still think that in the here and now, every data point that we’re getting, except for monthly payroll, is largely saying we have a pretty steady labor market with low hiring and low firing. That’s unusual, but that is where we are. That might be full employment and that’s the thing that we’re having to chew on a little bit… it’s important that we get the official data and if we don’t have the official data, we at least have some estimates that we can get from the private sector and the public sector. The longer we don’t have the highest quality data, the worse it’s going to be. The other thing that jumps out at you from these indicators is the stability of the job market. So far, it is not falling apart. The hiring rate is relatively low, but stable. The layoff rate is also low and stable, and the unemployment rate is largely unchanged, which is a point of stability. I am here on Kyla Scanlon’s show so you knew we had to talk about vibes. We are potentially going to be back into one of these conflicts between the data and the vibes sometime soon. Because if you look at the history of consumer sentiment, government shutdowns have often been correlated with big drops in consumer sentiment.”
I loved the nod he gave to “vibes”. I’ve covered before how it seems that increasingly more often, feelings and sentiment are louder than data and fact. However, good strong data still remains key to effective decision making. I love how Kyla summarized this conversation, so in her words:
“Oh, vibes: The Carlyle data reinforces a paradox: inflation is still sticky, while the labor market looks weak. Goolsbee’s indicators show a steady job market, not one in crisis, yet sentiment could deteriorate as the shutdown drags on. “We might be back into one of these conflicts between the data and the vibes,” he said. In other words: the real trilemma isn’t inflation-jobs-stability. It’s data-vibes-policy. The bigger picture is that we’re entering a phase where labor data itself is becoming a policy variable. The government shutdown, new private estimates, and the Chicago Fed’s real-time model all point to the same problem: we’re flying on fuzzier instruments. At the same time, the economy looks steady but thin with a job market that feels fragile beneath the surface. Goolsbee’s point is that we need to measure better before we can decide better because the next policy mistake may not come from getting the economy wrong, but from misreading the data that defines it.”
Gregory Daco , EY Chief Economist, published a thorough summary of the September FOMC meeting, and what we can likely expect moving forward. You can read the full report here, but I think this excerpt sums it up nicely:
“Looking ahead, most participants indicated that additional policy easing would likely be appropriate later this year, provided inflation continued to trend lower and labor market risks persisted. However, views diverged, with some participants noting that financial conditions were not particularly tight and warning against over-correcting. As always, participants emphasized that policy was not on a preset course and should be guided by incoming data and evolving risks. In their risk-management discussions, participants stressed the need to avoid both excessive easing—risking unanchored inflation expectations—and overly tight policy—risking unnecessary labor market deterioration. A balanced approach was deemed essential, recognizing the different speeds at which inflation and employment might return to their respective targets.”
Ultimately, I don’t think rate cuts in Q4 will have a short term impact on freight markets, so in my opinion, we are now looking into 2026. In the new year we will need to get a firmer read on how inflationary tariffs have been, how manufacturing activity can recover if it has a clear path forward (are we done with uncertainty?), if the labor market is still strong, and if consumer spending and health remains steady.
How Do Brokers Protect Profits in 2025? Rates are tight, costs are climbing but with Tai TMS, smart brokers are finding ways to grow. This eBook breaks down how top brokers use better carrier management, real-time data, and automation to protect margins in a tough market. Read Here

On that note, David Spencer and his team put together a great report each month, and their September report seemed to echo my thoughts around the end of 2025 heading into 2026, and expanded on what they predict that to mean for freight rates. They said:
“Tariff impacts will begin to compound in the back half of 2025 and carry into 2026, limiting the potential for demand growth. Additional demand destruction will result in more capacity leaving the market. With both forces on the decline, the current rate floor should remain in place with minimal further downside risk to spot rates. A flat to modest rate growth environment, with greater upside potential if demand trends inflect, is our base case for spot rates over the next year.” And “Without a meaningful capacity disruption or black swan event, spot rates are unlikely to cross contract rates. Rate growth and disruption duration throughout the year are expected to remain muted.”
FTR's most recent publication highlighted the uptick in spot rates so far in October, but it's still too early to know for sure how sustained these gains may be.
Broker-posted spot rates in the Truckstop.com system increased for all equipment types during the week ended October 3 (week 39). Dry van and refrigerated spot rates each rose by the most in five weeks, and flatbed spot rates posted their strongest gain since May. Dry van and flatbed spot rates rose in consecutive weeks for the first time since late June. Solid gains in van loads and still-high flatbed loads resulted in the strongest overall spot volume since the week after International Roadcheck week in May.
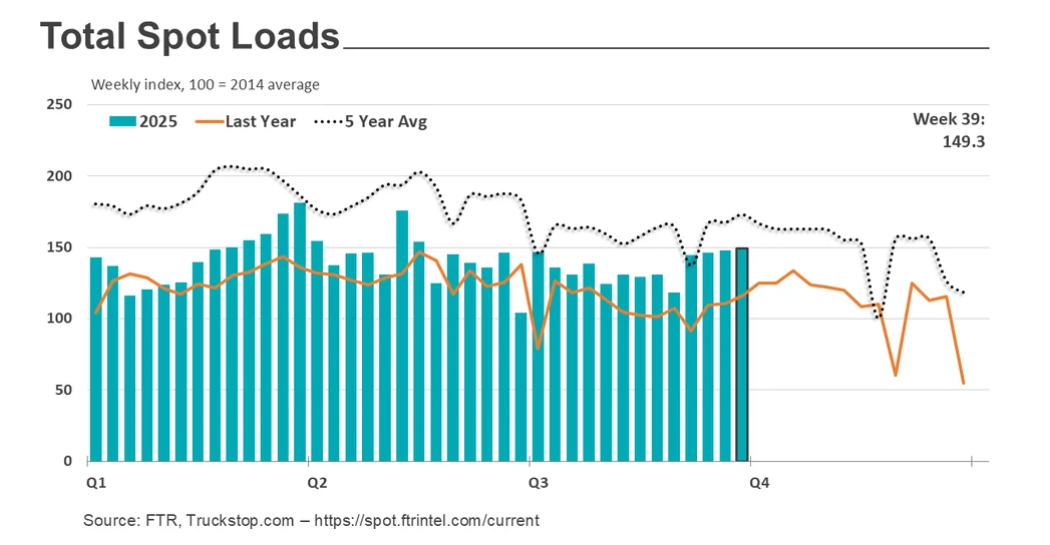
Total load activity ticked up 0.8% as a decline in flatbed load postings offset some of the gains in dry van and refrigerated. As we have noted frequently, a slight disconnect between 2025 and 2024 timeframes occasionally skews y/y comparisons. Total volume was almost 29% higher than last year’s week 39 but almost 19% higher than a more comparable period (week 40) last year. The difference also is notable spot rates as discussed below. Truck postings decreased 3.7%, and the Market Demand Index – the ratio of loads to trucks – rose to its strongest level since International Roadcheck week in May.
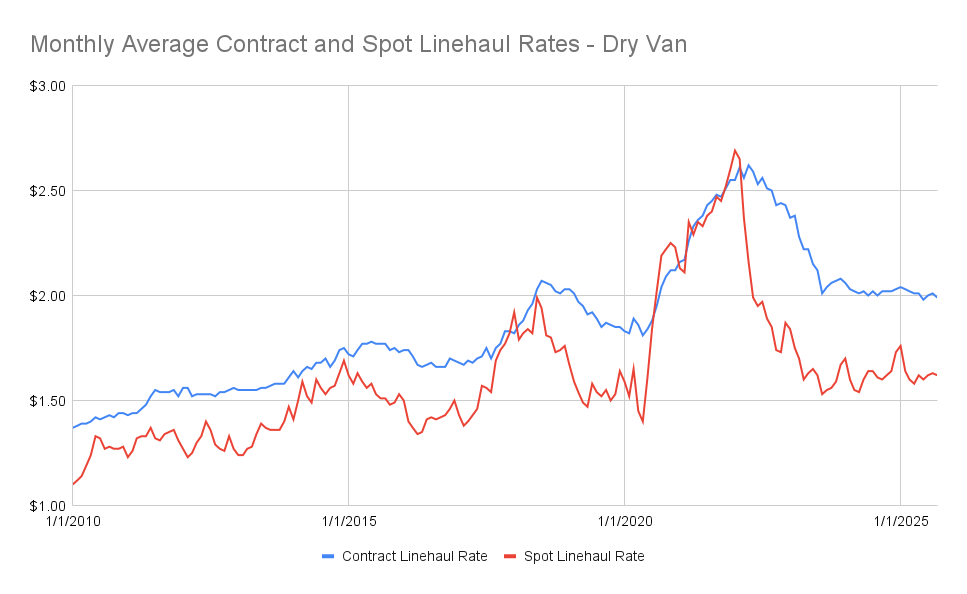
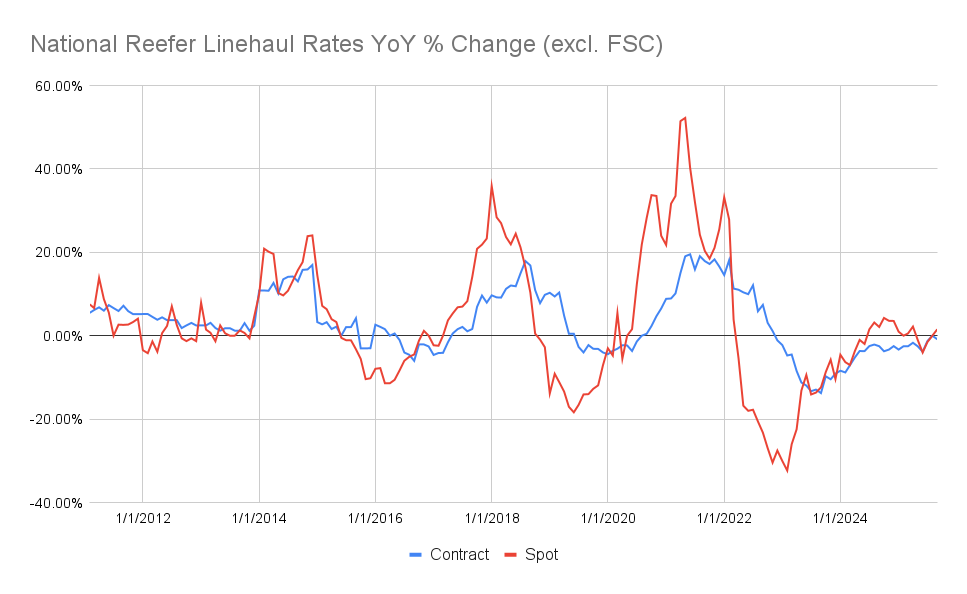
Spot and Contract Rate Check, provided by DAT:
The updated October charts provided by DAT show pretty steady movement for dry van contract and spot rates, but reefer rates have shown upward movement lately at least in spot markets. We should have a better idea by the end of October (and in the report published early November) if the early October rate movements will stick.


Meet Me For Coffee with Samantha Jones seeks to correlate macro-economics to freight markets (just like this Newsletter does) and offers a chance to hear various industry and non-industry experts explain their thoughts on economics and freight markets.
Thank you to our sponsor, Watco Logistics. As a leading 3PL, Watco Logistics provides rail, highway, intermodal, e-commerce and fulfillment, barge, international and cross-border solutions. At the core, Watco Logistics specializes in solving unique supply chain challenges. Learn more about Watco Logistics here!

Check out our Podcast Channels on your preferred platforms!

Save Money On Conferences!
Here is where Samantha is heading next, take advantage of her media sponsorship with these conferences to save $$ on your own registration! Questions about these shows, not sure which ones are for you? Message Samantha!
Discount to save $200 on your Manifest: The Future of Supply Chain & Logistics registration! ManifestVegas.com/MeetMeForCoffee
Thank you so much for reading and supporting the Truckload Market Update Report, produced by Samantha Jones Consulting LLC. Samantha Jones Consulting focuses on helping companies in the logistics industry better brand and sell their services to create sustainable revenue growth, and support their company growth goals!
We love Feedback, if you have questions, comments, suggestions, or are interested in sponsorships or partnerships, please email samantha@connectsjc.com to connect!
Make sure you subscribe to the Newsletter to receive the monthly update, and please share this with a friend who can also benefit from reading! As always, Samantha's work is free and created with the intent to add value to the transportation industry.
