


Have you walked onto a car lot recently and felt your jaw drop at the sticker prices? Or maybe you’ve noticed that while some of your neighbors are renovating their kitchens, others are struggling to keep up with rising grocery bills.
You aren’t imagining things. The economy is sending mixed signals, and understanding them is crucial for your financial health as we move further into the year.
In a recent episode of Meet Me For Coffee, host Samantha Jones sat down with Forrest Dougan, the Senior Director of Economic Strategy and Data Science at OPENLANE. They dove deep into the state of the US consumer, the realities of the automotive industry, and why the economy feels so different depending on who you ask.
Here is your breakdown of the Q1 economic outlook and what it means for your wallet.
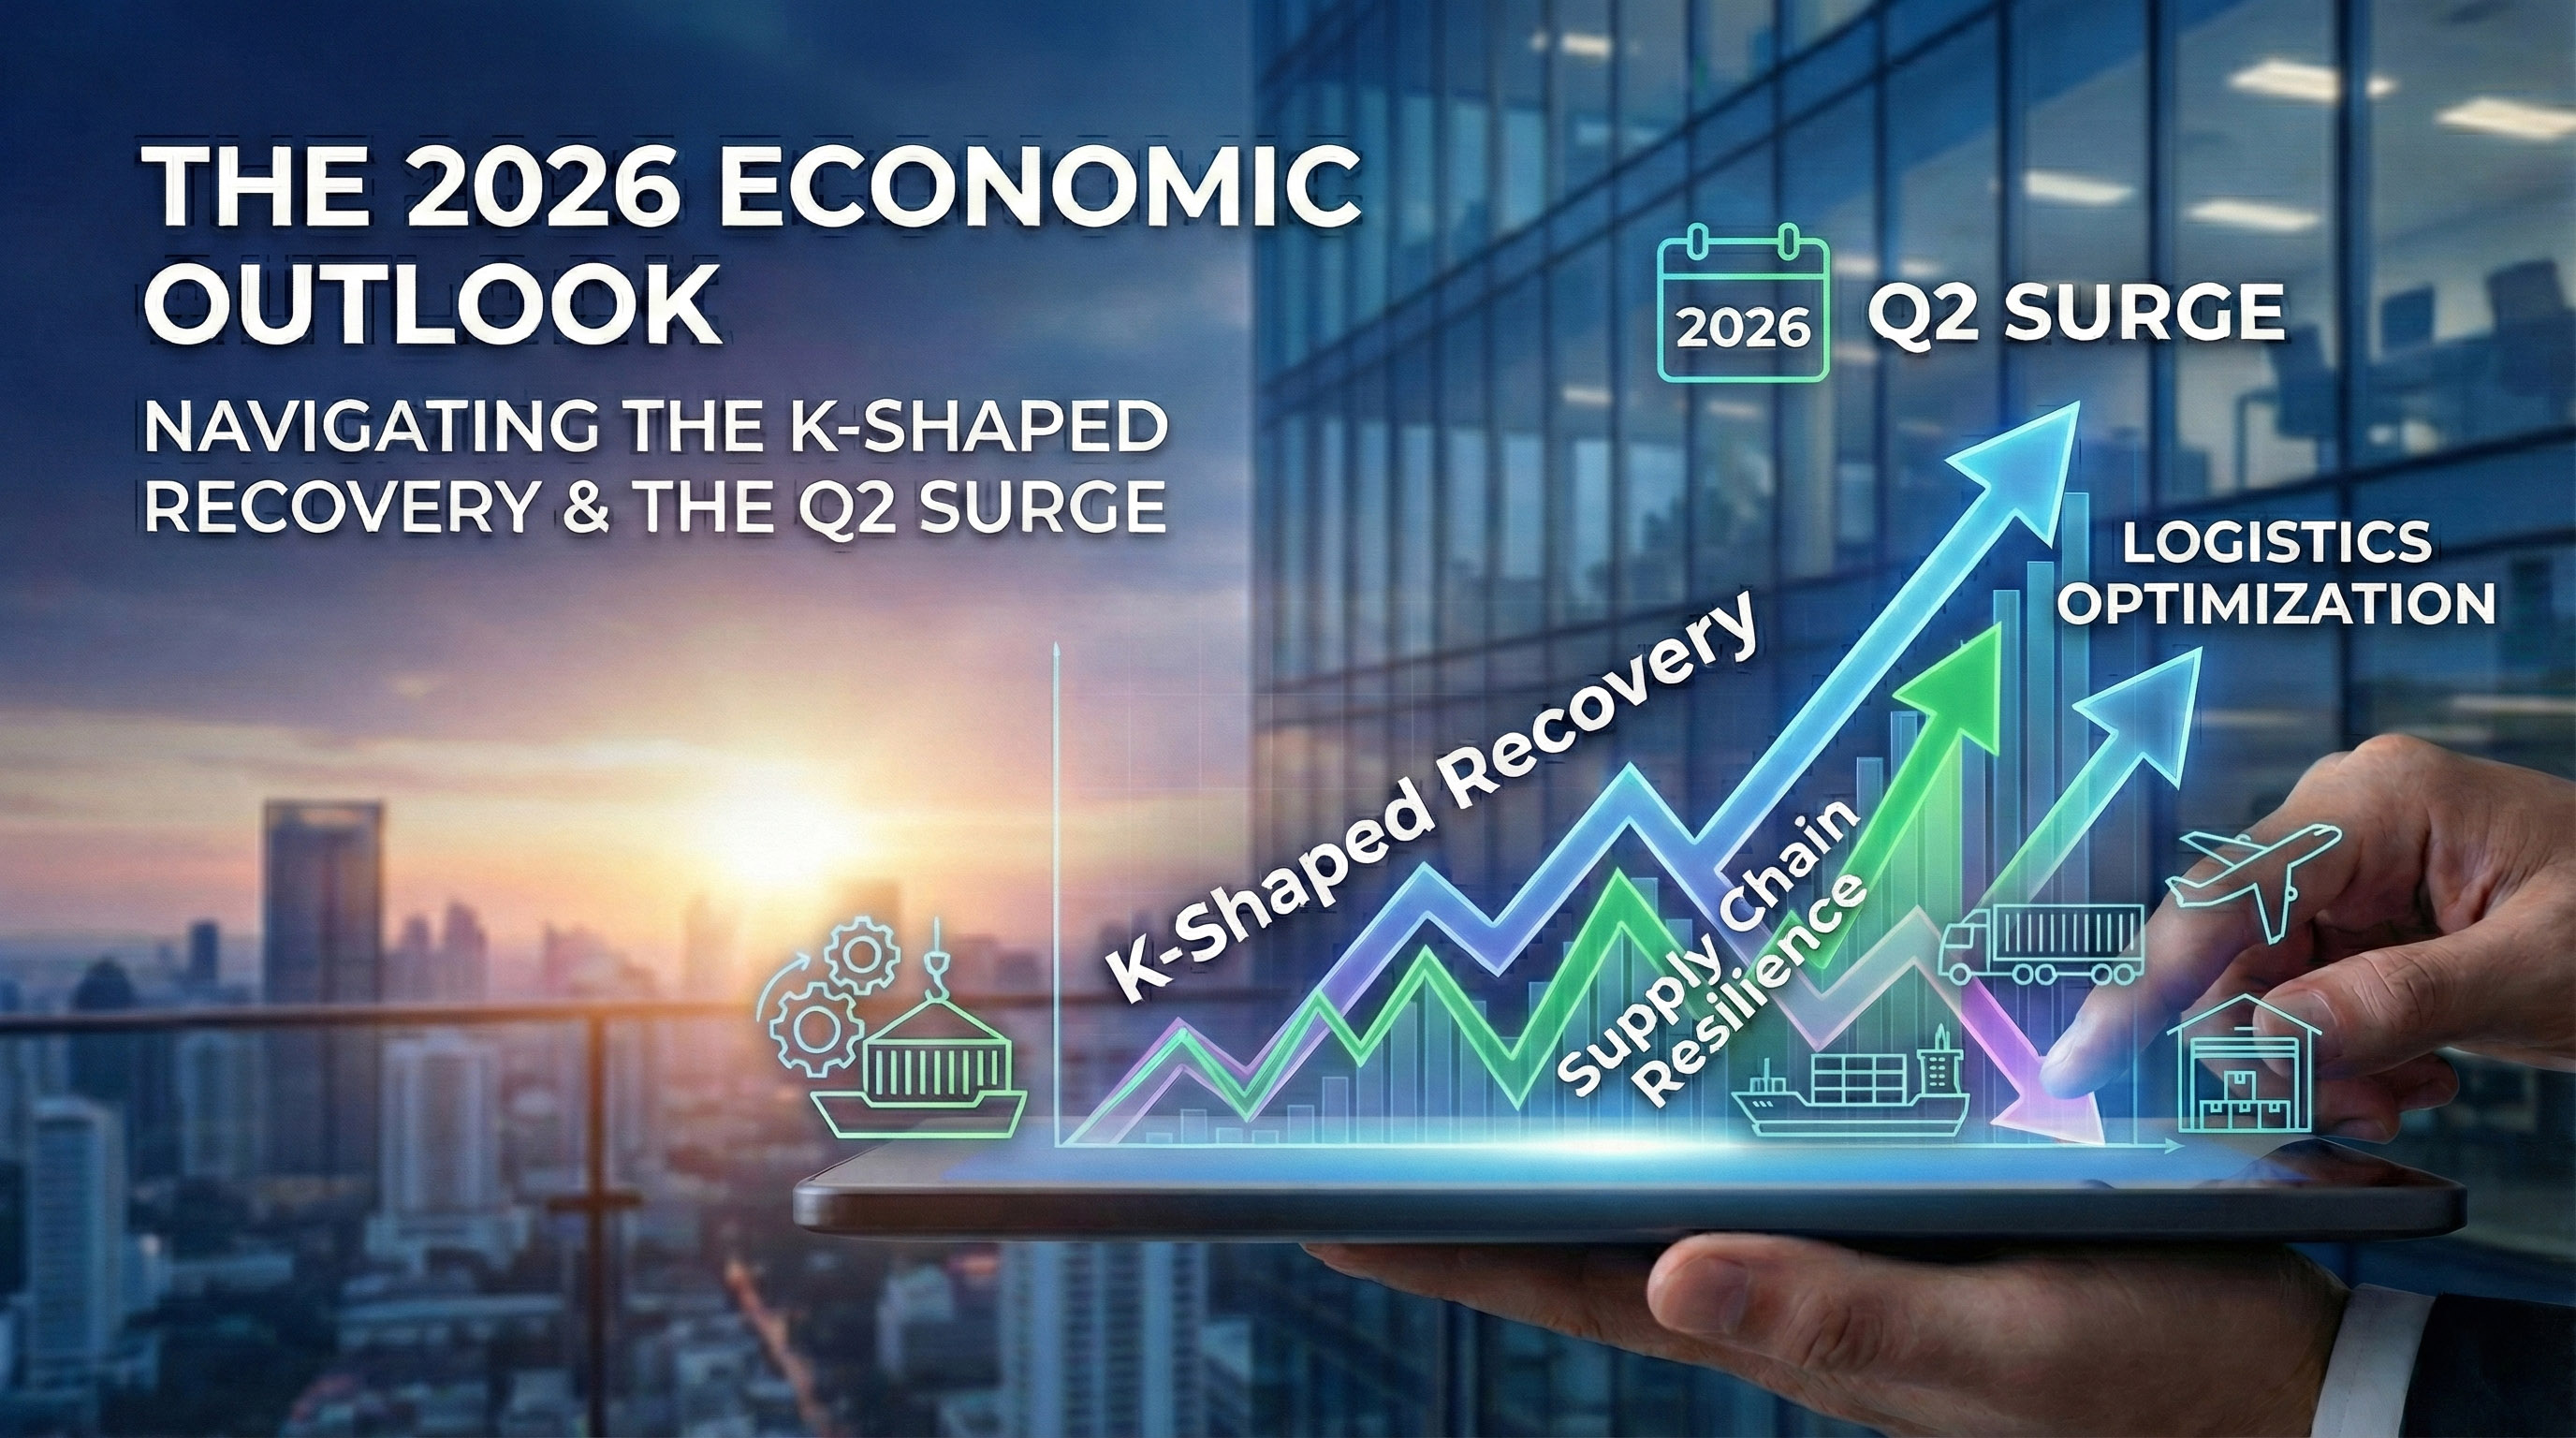
If you feel like the economic experience in America is bifurcated—split in two—you are right. Forrest Dougan describes the current landscape as a "K-Shaped Economy."
Imagine the letter K. The vertical line represents the economy before the pandemic. Then, the two arms branch off:
"The health of the retail consumer in the US is bifurcated," Dougan explains. "It's going in two different directions."
This divide explains why we see robust spending in some sectors (like travel and luxury vehicles) while simultaneously seeing rising delinquencies in basic consumer loans.
For many Americans, the most tangible evidence of inflation is parked in their driveway—or on the dealership lot.
Dougan points out a staggering statistic: The average price of a new car is hovering at or above $50,000. Compare that to 2019, when prices were in the $25,000 to $30,000 range.
A common question consumers ask is, "When will prices go back to normal?"
According to Dougan, if your definition of "normal" is 2019 pricing, the answer is likely never. He highlights the critical difference between disinflation and deflation:
"We don't want prices to go back to 2019 [levels] broadly," Dougan notes, referring to the economic damage required to make that happen. Instead, we are looking at a "new normal" where prices plateau at these higher levels.
If you want to know where the economy is heading, look at auto loan delinquencies.
Forrest identifies auto loans as a leading indicator of consumer health. Unlike a mortgage, which is often the last thing people stop paying (because they need shelter), or a credit card (which is unsecured), a car is a depreciating asset that requires monthly maintenance.
Currently, auto loan delinquencies are ticking up, touching levels we haven't seen since 2010. This signals that the "bottom arm" of that K-shaped economy is under immense pressure.
Adding fuel to this fire is the resumption of student loan payments and wage garnishments. The prime demographic for buying cars (ages 22 to 45) is also the demographic holding the most student debt.
When a household budget suddenly has to account for an extra $200-$400 monthly student loan payment, discretionary spending takes a hit. This leads to what Dougan calls "trading down" behavior:
So, what does this mean for the rest of the year?
The Q1 economic outlook is a story of two consumers. If you have stable income and good credit, you have options, though they are more expensive than they used to be. If you are budget-constrained, the environment remains challenging, requiring difficult tradeoffs between needs and wants.
As we navigate 2026, keep an eye on your own "personal economy." Prioritize cash flow, maintain your credit score, and be prepared for this high-price plateau to stick around for the long haul.
Want more insights on business, the economy, and how to navigate the year ahead? Subscribe to the Meet Me For Coffee podcast for weekly conversations with industry leaders.


Read the May Truckload Market Update for expert insights on fuel prices, freight rates, inflation, and AI. Plus, grab a $1,400 Manifest Las Vegas discount code!
Read MoreRead the March 2026 Special Edition from Samantha Jones-Beach for the latest expert insights on the economy, hiring trends, and the future of the supply chain.
Read More